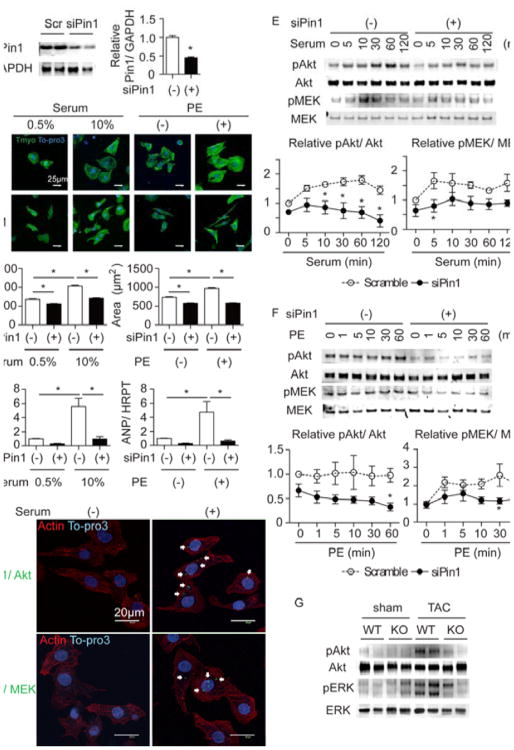
Figure 3. Loss Pin1 attenuates cardiomyocyte hypertrophy in vitro via regulating Akt and MEK pathway.
A, Immunoblot showing Pin1 expression after scramble (scr) or Pin1 specific siRNA treatment (siPin1) in neonatal rat cardiomyocytes (NRCMs, left) and densitometric quantification (right). *p<0.05 versus Scr. n=8. B, Immuncytochemistry of NRCMs treated with 10% serum or phenylephrine (PE) and stained for tropomyosin (Tmyo, green) and To-pro3 (blue) after scramble or siRNA treatment (upper panel). Quantification of cardiomyocyte area on the right. *p<0.05. n=3. C, Quantitative RT-PCR showing ANP expression in NRCMs under the same conditions as in B. *p<0.05. n=3. D, Proximity ligation assay (PLA) showing direct interaction of Pin1 with Akt (upper panel) or MEK (lower panel) in cardiomyocytes (green dots, white arrows) with (right) or without stimulation (left). Cardiomyocytes were also stained with Tmyo (red) and To-pro3 (blue). E, Immunoblots showing time course analysis for Akt and MEK phosphorylation after serum stimulation in scramble and siPin1 treated NRCMs (upper panel). Densitometric quantification is shown in the lower panel for Akt (left) and MEK (right). n=5. F, Immunoblot showing time course analysis for Akt and MEK phosphorylation after PE stimulation in scramble and siPin1 treated NRCMs (upper panel). Densitometric quantification is shown in the lower panel for Akt (left) and MEK (right). n=6. G, Immunoblot showing Akt and ERK phosphorylation in the heart of WT and Pin1 KO (KO) mice at 4 days after TAC.

