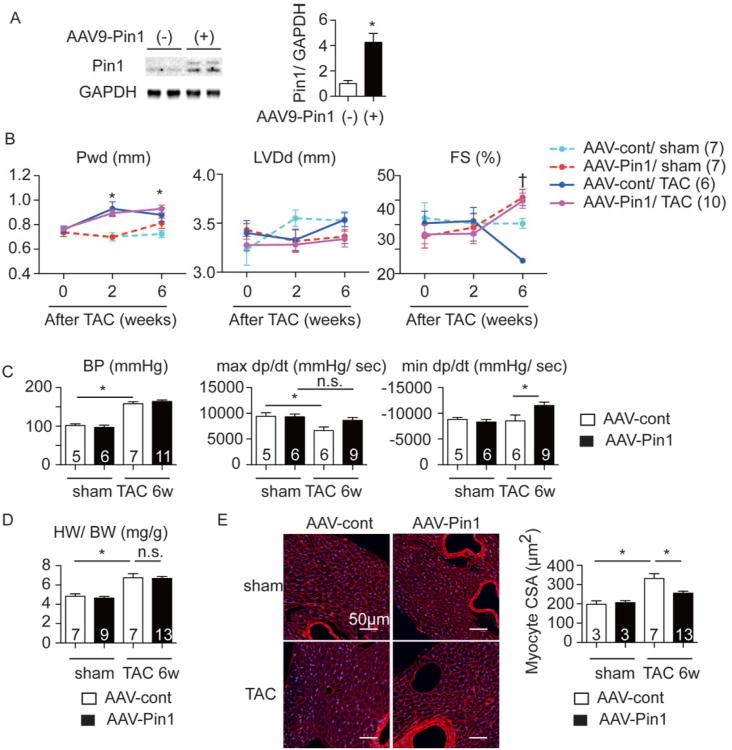
Figure 4. AAV9-Pin1 attenuates hypertrophy and preserves cardiac function upon pressure overload.
A, Immunoblot showing Pin1 expression in the heart of mice injected with empty AAV9 vector (AAV-cont) and with AAV9 harboring Pin1 (AAV-Pin1). The right panel shows densitometric quantification of Pin1 expression. n=3-4. B, Echocardiographic analysis at the indicated time points after TAC procedure showing posterior wall thickness at diastole (Pwd), left ventricular dimension at diastole (LVDd), and fractional shortening (FS). * p<0.05 vs WT sham, † P<0.05 versus WT TAC at the same time point. C, Invasive hemodynamic assessment 6 weeks after TAC showing arterial systolic blood pressure (BP), maximal (max dp/dt) and minimal (min dp/dt) changes of developed pressure over time. * p<0.05. n.s., not significant. D, Heart weight to body weight ratio (HW/ BW) at 6 weeks after TAC. *p<0.05. n.s., not significant. E, Sections 6 weeks after TAC stained with Wheat Germ Agglutinin (WGA, red) and To-pro3 (blue) (left), quantification of cross sectional area of cardiomyocytes (CSA, right). *p<0.05.

