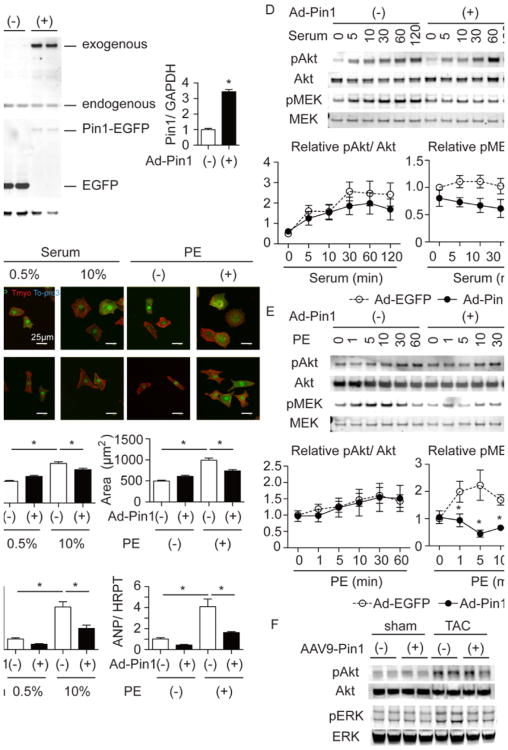
Figure 5. Over-expression of Pin1 attenuates cardiomyocyte hypertrophy in vitro via regulating MEK pathway.
A, Immunoblot showing Pin1 and GFP expressions in NRCM transduced with adenovirus expressing EGFP (Ad-EGFP) or Pin1-EGFP (Ad-Pin1). The right panel shows densitometric quantification of Pin1 expression. * p<0.05. n=6. B, Immuncytochemistry of NRCMs treated with 10% serum or phenylephrine (PE) and stained for GFP (green), tropomyosin (Tmyo, red) and To-pro3 (blue) after Ad-EGFP or Ad-Pin1 induction (upper panel). Lower panel showed cell size quantification only of cardiomyocytes expressing EGFP. *p<0.05. n=3. C, Quantitative RT-PCR showing ANP expression in NRCMs under the same conditions as in B. * p<0.05. n=3. D, Immunoblot showing time course analysis for Akt and MEK phosphorylation after serum stimulation in Ad-EGFP and Ad-Pin1 transduced NRCMs (upper panel). Densitometric quantification is shown in the lower panel for Akt (left) and MEK (right). n=7. * p<0.05 versus control at the same time point. E, Immunoblot showing time course analysis for Akt and MEK phosphorylation after PE stimulation in Ad-EGFP and Ad-Pin1 transduced NRCMs (upper panel). Densitometric quantification is shown in the lower panel for Akt (left) and MEK (right). n=6. * p<0.05 versus control at the same time point. F, Immunoblot showing Akt and ERK phosphorylation in the heart of AAV-cont and AAV-Pin1 mice at 4 days after TAC.

