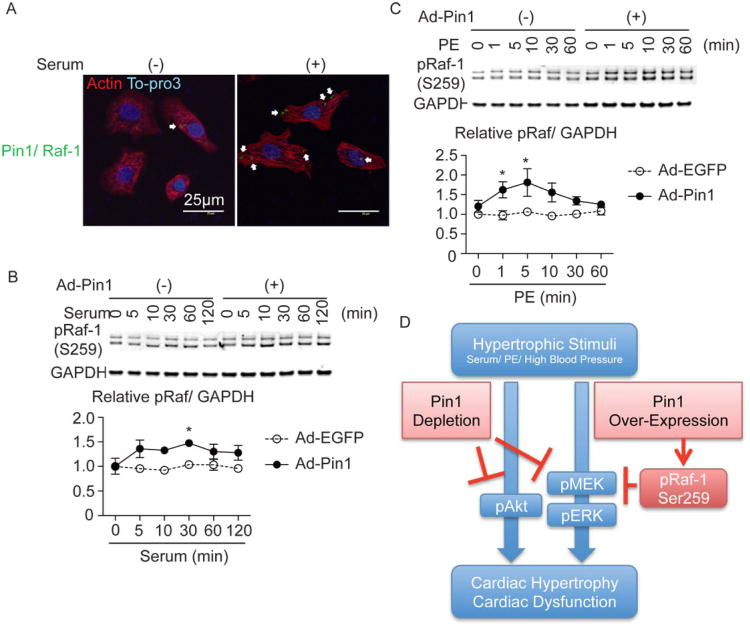
Figure 6. Raf-1 phosphorylation on an autoinhibitory site is increased in the cardiomyocyte transduced with Ad-Pin1.
A, Proximity ligation assay (PLA) showing direct interaction of Pin1 with Raf-1 in cardiomyocytes (green dots, white arrows) with (right) or without stimulation (left). Cardiomyocytes were also stained with tropomyosin (Tmyo, red) and To-pro3 (blue). B, Immunoblots showing time course analysis for Raf-1 phosphorylation on Ser259 (pRaf) after serum stimulation in EGFP and Pin1 treated NRCMs (upper panel). Densitometric quantification is shown in the lower panel for pRaf. n=5. * p<0.05 versus control at the same time point. pRaf protein levels were normalized with GAPDH as a loading control. C, Immunoblots showing time course analysis for pRaf after phenylephrine (PE) stimulation (upper panel). Densitometric quantification is shown in the lower panel for pRaf. n=5. * p<0.05 versus control at the same time point. pRaf protein levels were normalized with GAPDH as a loading control. D, Schematic showing the mechanistic impact of Pin1 depletion as well as over-expression upon cardiac hypertrophy.

