
Figure 2. Focus placement with real-time ISAM on ex vivo mouse muscle.
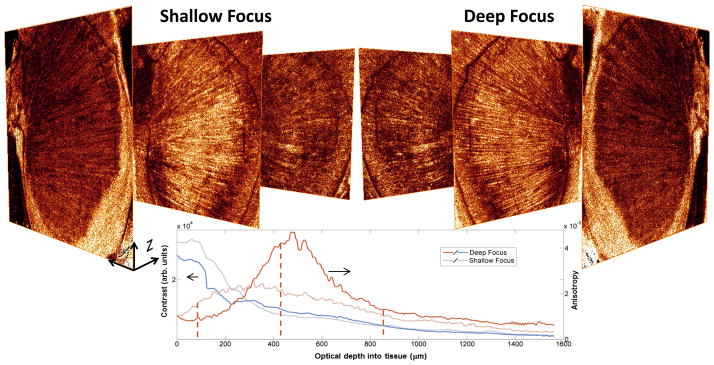
Left image stack shows three en face planes (depths denoted as dashed lines in the chart) from an ISAM tomogram with a focus placed shallow (310 μm) in the tissue. The right image stack shows the corresponding slices from an ISAM tomogram with the focus placed deeper (1000 μm) in the sample. The tomogram with a deep focus has a slight loss in signal near the surface, but deep in the sample, the strategically placed focus enhances fine muscle structures. These results are quantified using anisotropy and contrast as image quality metrics in the chart. En face planes shown have transverse dimensions of 3.2 × 3.2 mm.