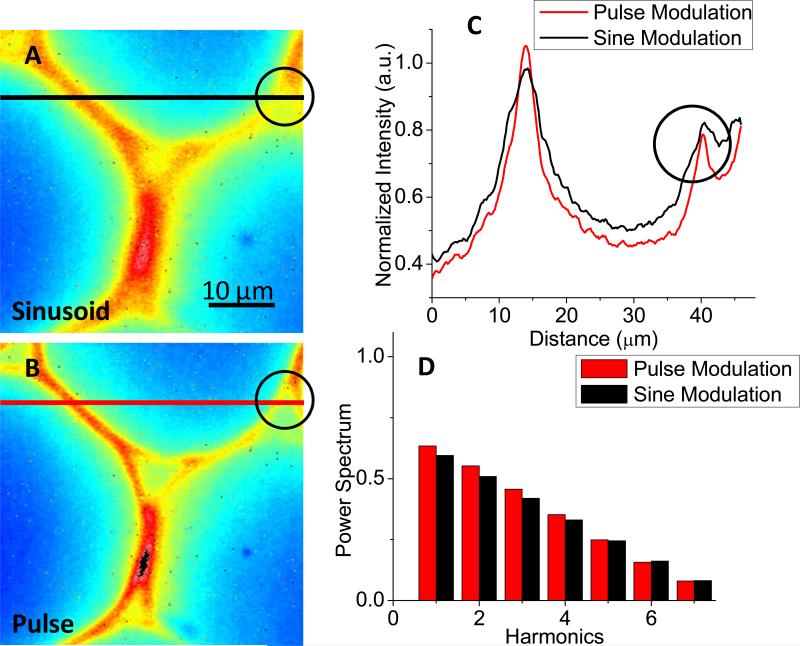
Figure 6.
Comparison of the pulse modulation and the sinusoidal modulation. The offset was +1.4V. The exposure time was 100 ms and the MCP voltage was 800V. Measurement was done with 16 phase-steps and 320 frames for average. A-B), a convularia sample was imaged with the pulse modulation and sinusoidal modulation methods, respectively. C) Line profiles at the same position in A and B. The optical resolution is better with the pulse modulation method. Details in the black cycles in A to B are distinguishable. D) The harmonic components obtained in A and B.

