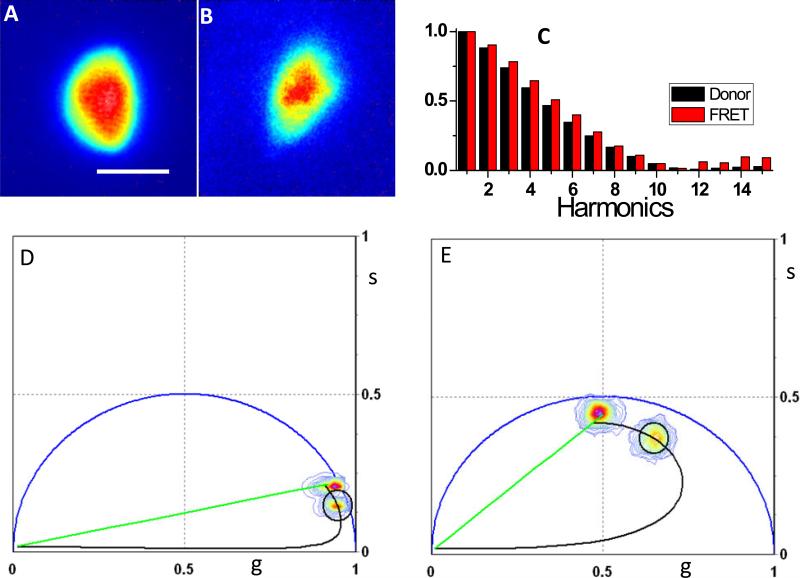
Figure 7.
Determination of FRET efficiency at multi-frequencies. Images of CHO-K1 cells expressing A) cerulean donor and B) Cerulean-Venus FRET constructs. C) Normalized power spectra of the donor only cell and the FRET cell. D) 20 MHz and E) 100 MHz phasor plot. The phasor calculator was used to determine graphically the FRET efficiency of Cerulean-Venus cell. Scale bar is 10 μm.

