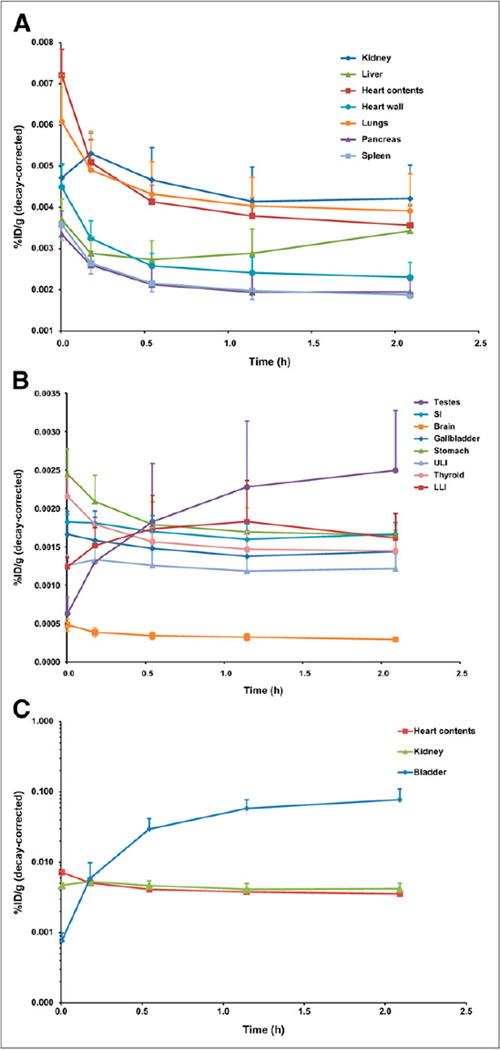
FIGURE 1.
Mean biodistribution curves plotted for decay-corrected percentage injected dose per gram of organ mass vs. time. Time axis represents average time over all patients for each PET scan because some patients (i.e., tall patients) required more bed positions. (A) Organs with higher uptake. (B) Organs with lower uptake. (C) Increasing urinary bladder activity. LLI = lower large intestine; SI = small intestine; ULI = upper large intestine. %ID/g = percentage injected dose per gram of organ mass.

