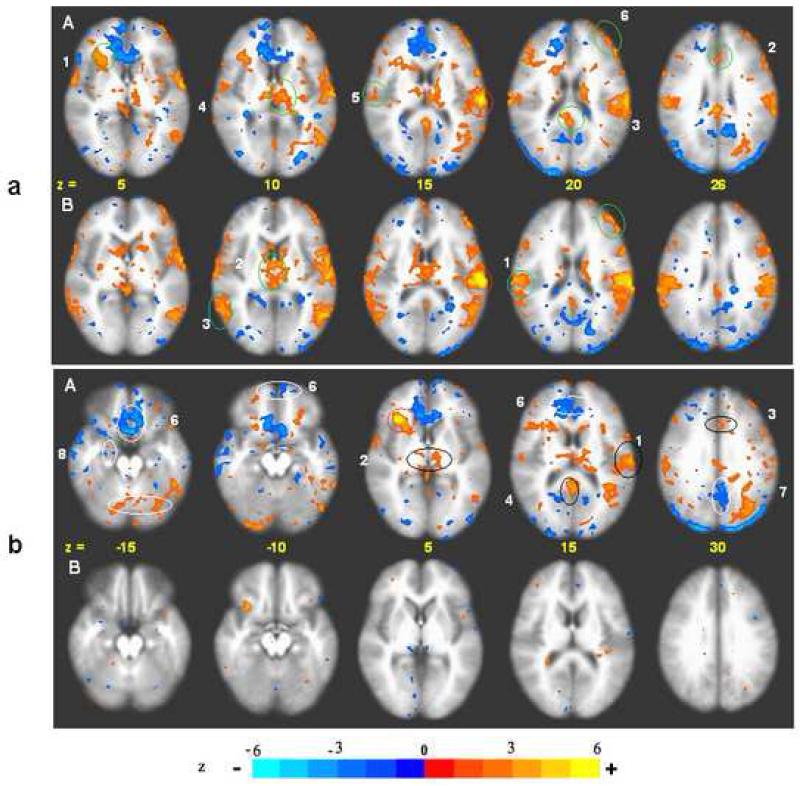
Fig. 4.2.
CCA: Acupuncture vs. tactile stimulation, Activation network. p < 0.001
a) SII, left (contralateral) Figure A. Acupuncture: Ref. voxel (−59, −20, 17). Correlations are seen with the right anterior insula (1), ant-midC (2). postC_BA23d (3), thalamus (4), ipsilateral SII (5), DLPFC_BA46 (6). Figure B. Tactile stimulation: Ref. voxel (−59, −21, 16). Correlations are seen with ipsilateral SII (1), thalamus (2), lateral temporal association cortex (3), DLPFC BA46 (4), stronger than in acupuncture, but no significant correlation with right anterior insula and midC.
b) Anterior Insula, right. Figure A. Acupuncture: Ref voxel (32, 26, 6). Positive correlations (circled in black) are seen with SII (1), thalamus (2), midC (3), postC_BA23 (4), BA22 (5). Negative correlations (circled in white) are seen with MPFC (BA10/32/24/11/25) (6), MPC (BA31/7) (7), MTL (Hpc, PHpc) (8). Figure B. Tactile stimulation: Ref voxel (32, 26, 6). No significant signal change or regional correlations were found.

