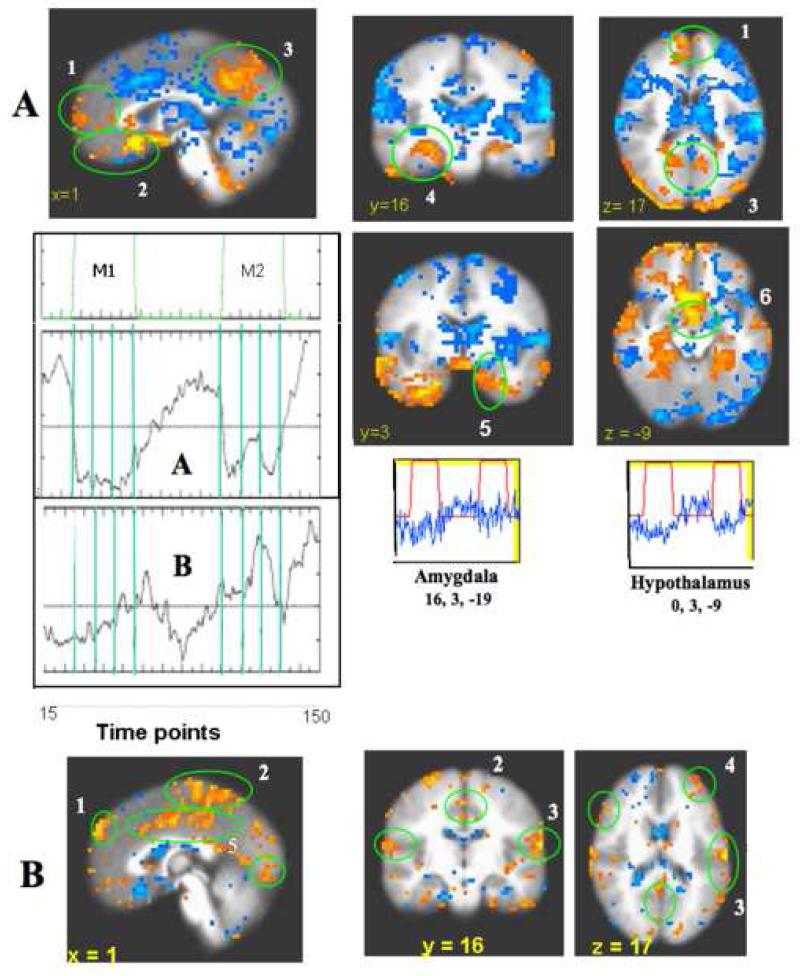
Fig. 5.
Functional connectivity by pICA. Acupuncture at right LI4, ST36 and LV3 in 201 runs on 48 subjects. Time courses derived from pICA are shown for both Deactivation (A) and Activation (B) networks. In addition, the time-course for voxels within the Amy and Hypothalamus from our initial dataset are shown. A. Deactivation network. p < 0.0001: The clusters of deactivated regions in the MPFC (1, 2), MPC (3), and MTL (4, 5) and the Hypo (6) were almost identical in temporal and spatial characteristics to standard GLM and CCA analysis methods. The Amy (5) was involved. B. Activation network. p < 0.005: Prominent coherent activation occurred in the sensorimotor and association cortices such as the antero-DMPFC (1), SMA/paracentral lobule (2), SII (3), DLPFC (4), and midC/postC_BA23d (5) are shown. Correlation is seen across hemispheres. ICA was used for generalized trend and pattern across-checking purposes, not primary analyses. The colors follow general trends with reds-yellows representing increasing positive correlation and blues (dark-light) representing increasing anti-correlation.

