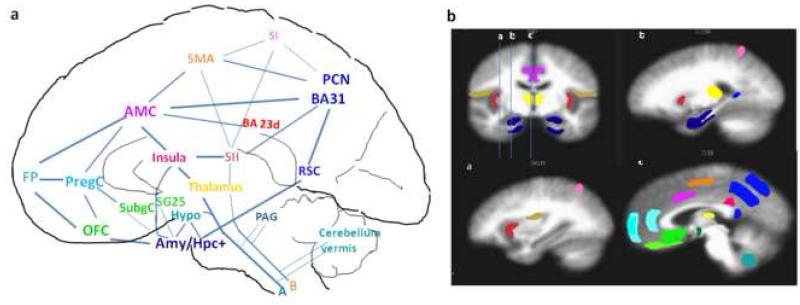
Fig. 7.
Functionally anticorrelated brain networks involved in acupuncture action. In the schematic diagram of a mid-sagittal section (Fig a), deactivated regions are color-coded in cool colors (blue/green) and activated regions in warm colors (red, etc) The areas corresponding to those in the schematic diagram are shown in the MRI sections in Fig b, a coronal slice through the amygdala and 3 sagittal slices as indicated on the coronal section. Regions of deactivation in the limbic-paralimbic-neocortical network (LPNN) aggregate in the medial prefrontal cortex { frontal pole (FP), pregenual and subgenual cingulate (pregC, subgC), subgenual area (SG25), orbitofrontal cortex (OFC)}, medial parietal cortex {precuneus (PCN), post-cingulate_ BA31) }, retrosplenial cortex (RSC)_BA29,30, and medial temporal lobe {amygdala (Amy), hippocampal formation (Hpc+), located lateral to the schematic section}. The hypothalamus, pontine nuclei and cerebellar vermis also showed deactivation. The SII, right anterior insula, antero-middle cingulate (AMC), supplementary motor area (SMA), posterior cingulate_BA23 dorsal, and sensory divisions of the thalamus comprise the activation network. Several associated cortical areas and the basal ganglia showing activation or deactivation are not shown. The figure is partly adapted from Apkarian’s figure on pain perception and regulation (Apkarian et al., 2005)

