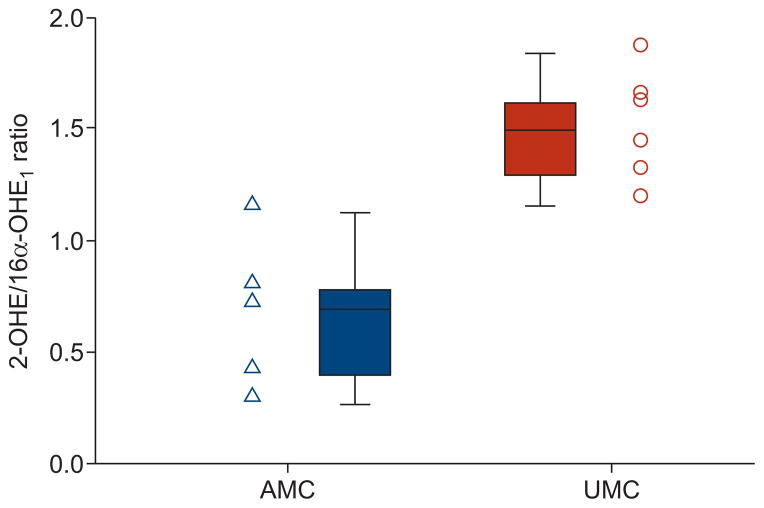
FIGURE 1.
Ratio of urinary 2-hydroxyoestrogen (2-OHE) to 16α-hydroxyoestrone (16α-OHE1) in affected BMPR2 mutation carriers (AMCs) versus unaffected BMPR2 mutation carriers (UMCs) (ng per mg creatinine per mL). AMCs have a significantly reduced ratio compared to UMCs (p=0.006). Data points and box plots are shown for each group. Box and whisker plots represent the median value, interquartile range and highest and lowest values.

