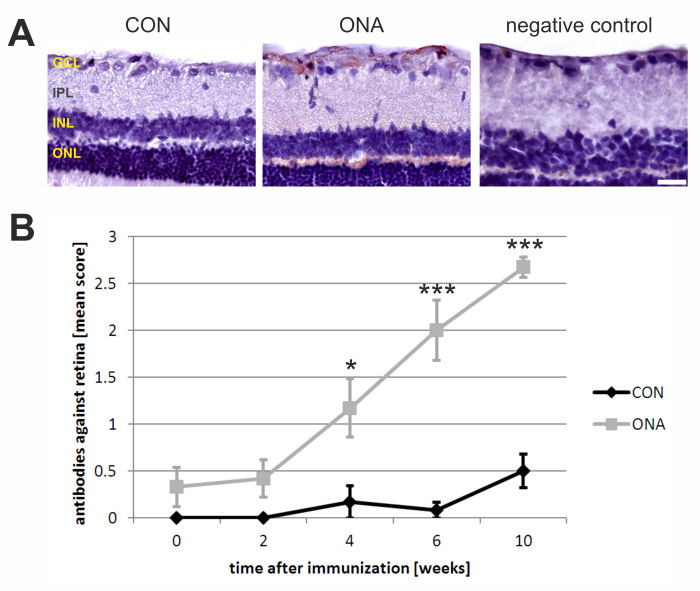
Figure 3.
Increase in autoreactive antibody levels against the retina. A: Exemplary retinal cross-sections incubated with serum from a control (CON; left) and an optic nerve homogenate antigen (ONA) animal (middle) at 10 weeks (n=6/group). While basically no staining was observed on CON slides, strong staining due to autoantibody binding from ONA sera occurred. These antibodies bound especially to the nerve fiber and the ganglion cell layer (GCL). The negative control (right) was incubated only with secondary antibody and showed no staining. B: The diagram shows the mean autoantibody levels against the retina at different points in time. A continuous increase in autoantibodies was noted in the ONA group, while levels in the CON group stayed around baseline. At 4 (p=0.02), 6 (p=0.0002), and 10 weeks (p=0.000001), the mean antibody score in the ONA group was significantly higher than in the CON group. The Student t test was performed for every time point. Values represent mean±standard errors of the mean (SEM). Abbreviations: IPL=inner plexiform layer, INL=inner nuclear layer, ONL=outer nuclear layer (*: p<0.05; ***: p<0.001; scale bar: 50 µm).

