Figure 1.
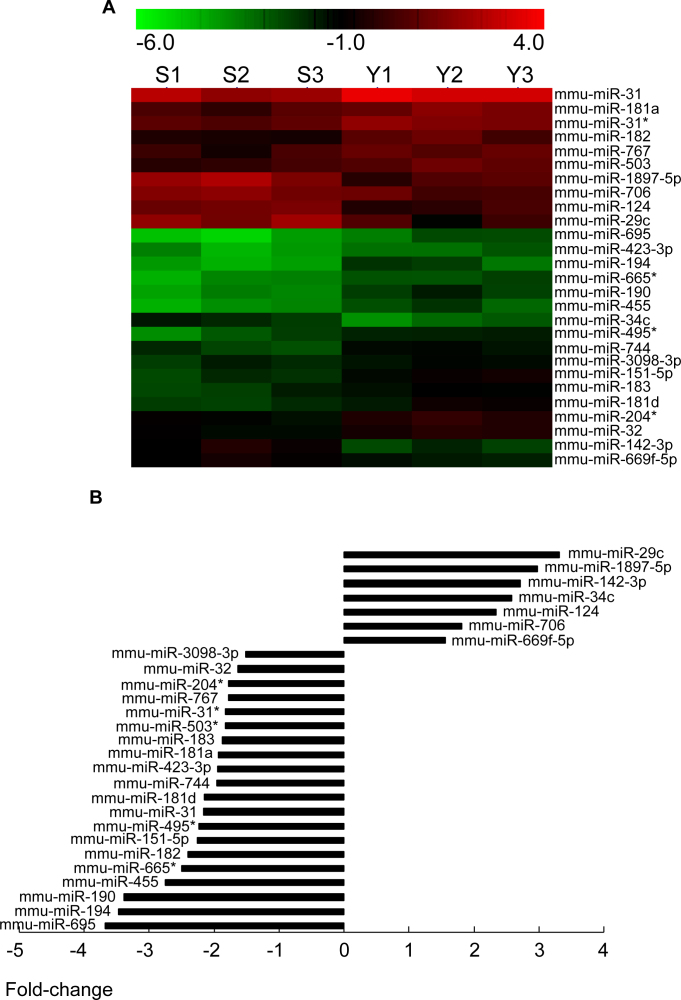
MicroRNA profiles were performed between the corneal endothelium of young and old mice. A: Hierarchical clustering was performed with normalized microRNA (miRNA) data (fold change >2) that passed the Student t test (p<0.05). A total of 27 miRNAs were identified whose expression was significantly altered in the corneal endothelium of young and old mice. Rows, miRNA; Column, the corneal endothelia of young mice (Y1, Y2, and Y3) and old mice (S1, S2, and S3). For each miRNA, red color indicates genes with high expression and green color denotes genes with low expression. B: Fold change (ratio between old/young animals) in miRNA expression between the corneal endothelium of young mice and old mice. The corneal endothelia of young mice were used as control. The fold change ranged from −3.31 to −1.56 and from 1.53 to 3.67 for the upregulation and downregulation of miRNAs, respectively. Mmu-miR-29c exhibited the greatest decrease in expression, whereas mmu-miR-695 exhibited the greatest increase in expression in the old mice.

