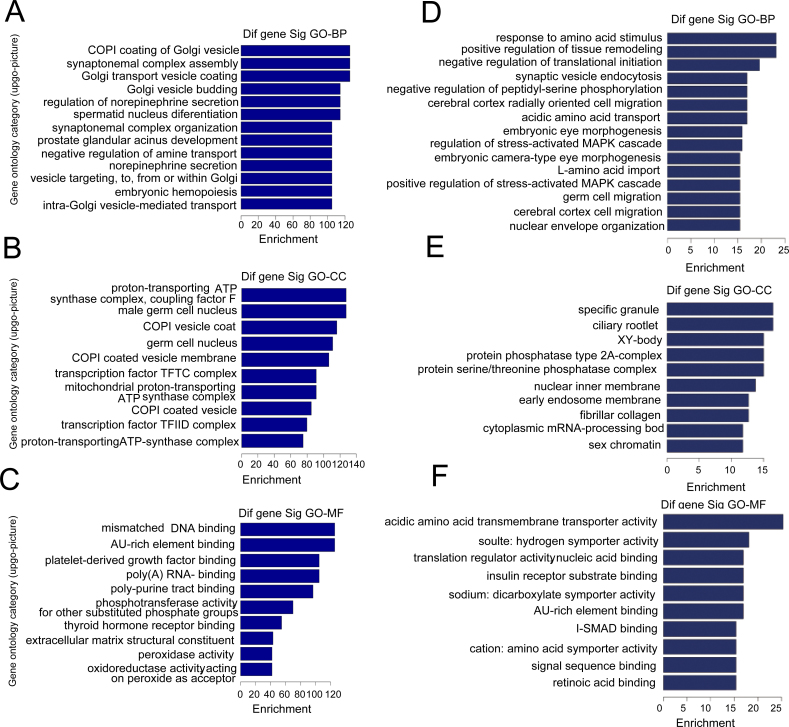
Figure 3.
Microarray-based Gene Ontology analysis of differentially expressed microRNAs. A, B, and C: Gene ontology (GO) analysis of the most significantly upregulated microRNAs (miRNAs). D, E, and F: GO analysis of the most significantly downregulated miRNAs. The three GO classifications—molecular function (MF), biological process (BP), and cellular component (CC)—were evaluated separately and the significant terms of all ontologies are shown. The upregulated genes in the progressors were enriched in the coat protein (COPI) coating of Golgi vesicles (A), proton-transporting ATP synthase complex (B), and mismatched DNA binding (C), whereas downregulated genes in the progressors were enriched in tissue remodeling (D), stress-activated mitogen-activated protein kinase cascade (E), and insulin receptor substrate binding (F).

