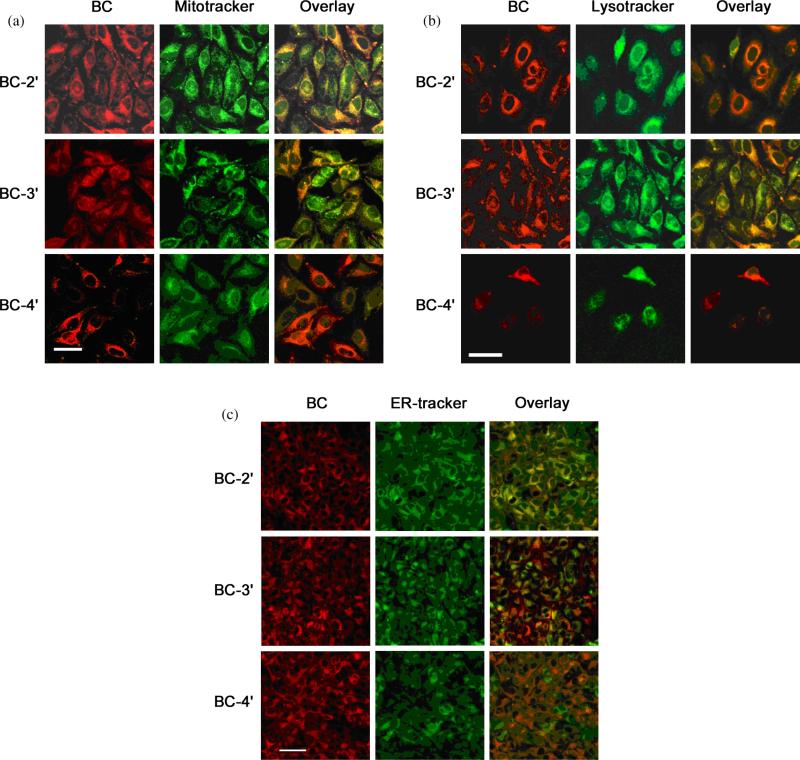
Fig. 5.
Subcellular localization by confocal microscopy. For all panels (a–c), the left columns display bacteriochlorin red fluorescence, the middle columns display green fluorescence from organelle-specific probes, and the right columns display the overlays of the bacteriochlorin and probe fluorescence. Bacteriochlorins were used at 250 nM for 24 h and probes at 5 μg/mL for 30 min. (a) MitoTracker; (b) LysoTracker; (c) ER-Tracker. Scale bar = 50 μM for a and b, and 100 μm for c

