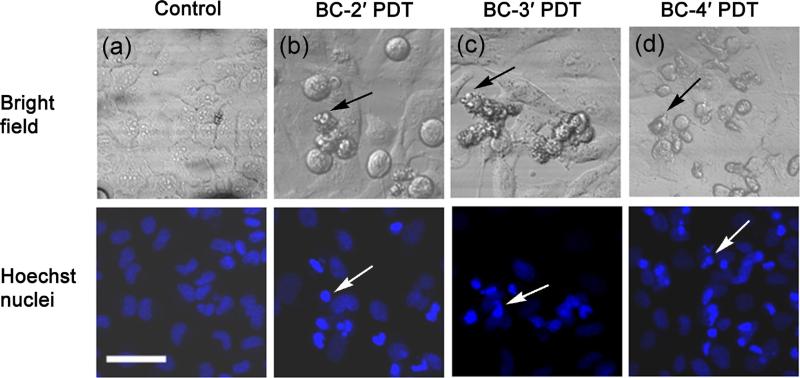
Fig. 6.
Cellular morphology by bright-field fluorescence microscopy of PDT-treated cells. (a) Control cells; (b) BC-2′, PDT treated; (c) BC-3′, PDT treated; (d) BC-4′, PDT treated. Nuclear morphology of PDT-treated cells by Hoechst fluorescence staining of nuclei: (a) control cells; (b) BC-2′, PDT treated; (c) BC-3′, PDT treated; (d) BC-4′, PDT treated. Scale bar = 100 μm

