
Fig. 6.
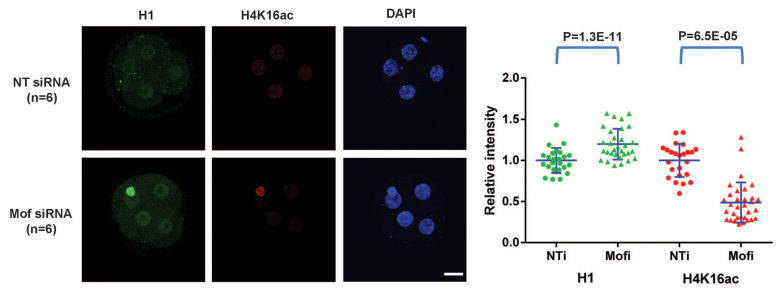
Knockdown of Mof and H4K16ac leads to increased levels of H1. Immunofluorescence (left panel) and scatter plots of quantification (right panel) of H1 (red) and H4K16ac (green) in NT siRNA and Mof siRNA embryos at the four-cell stage. Scale bar: 20 μm. All error bars indicate s.d.