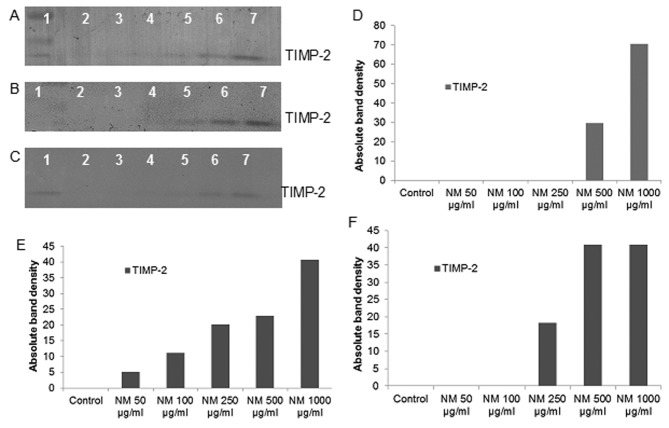
Figure 7.
Effect of NM on fibrosarcoma HT-1080, chondrosarcoma SW-1353 and liposarcoma SW-872 TIMP-2 expression. Reverse zymograms of (A) HT-1080, (B) SW-1353 and (C) SW-872 TIMP-2 expression. Lane 1, markers; lane 2, control; lanes 3–7, NM 50, 100, 250, 500 and 1,000 μg/ml. Densitometric analyses of (D) 1080, (E) SW-1353 and (F) SW-872 TIMP-2 expression.

