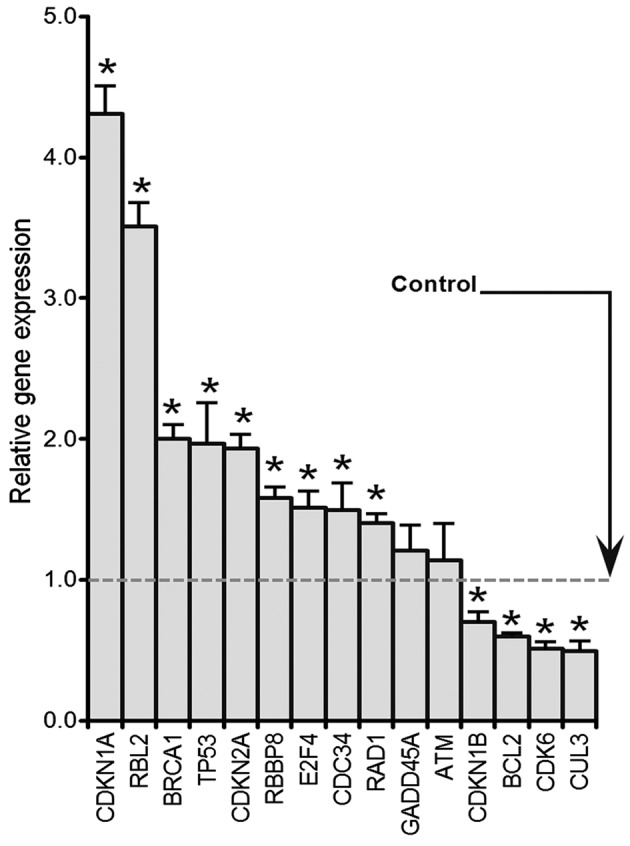
Figure 4.

Relative expression of selected cell cycle arrest related genes examined by qPCR array. A human cell cycle RT2 Profiler PCR array plate was used to assess the expression of cell cycle related genes. Representative upregulated and downregulated genes are shown. Data are expressed as mean ± SD, relative gene expression was normalized using β-actin as a control and calculated by the 2−ΔΔct method (*p<0.05).
