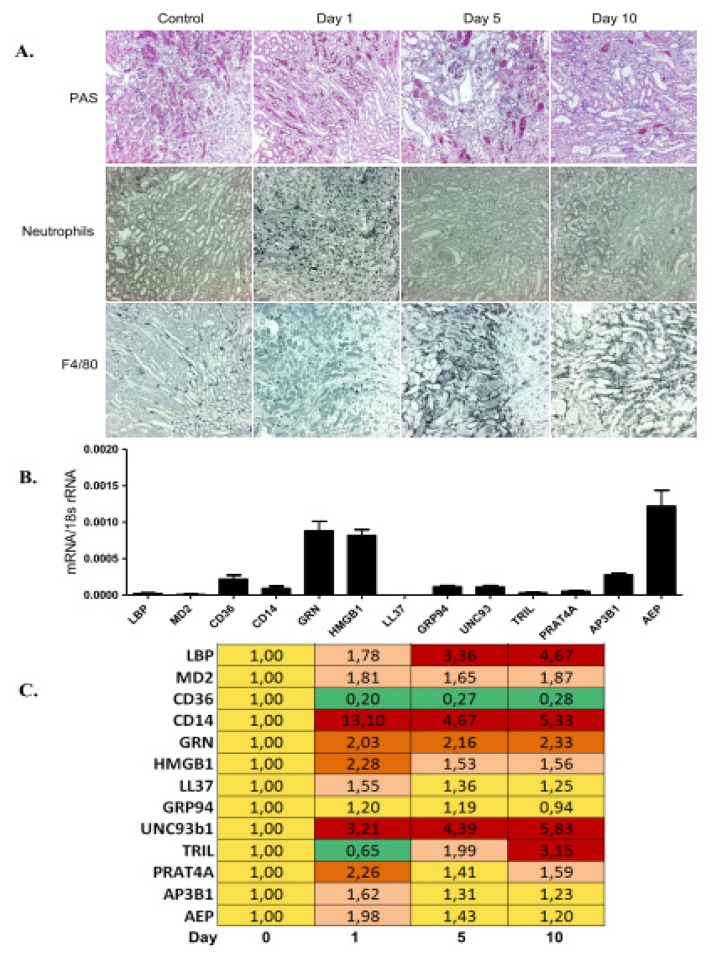
Figure 2.
TLR accessory molecule mRNA expression during ischemia-reperfusion injury. (A) Renal ischemia-reperfusion injury was induced as described in methods. Representative images of renal sections stained with PAS or for neutrophils and macrophages are shown at three time points as indicated. Original magnification: ×200. Real-time PCR was performed on cDNAs derived from the kidney at baseline; and upon unilateral kidney ischemia reperfusion mice on day 1, 5 and 10; (B) The histogram represents the mRNA expression levels of different genes of the wild type kidney (control); (C) The table represents the relative expression of mRNA levels versus control using the colour code as illustrated.

