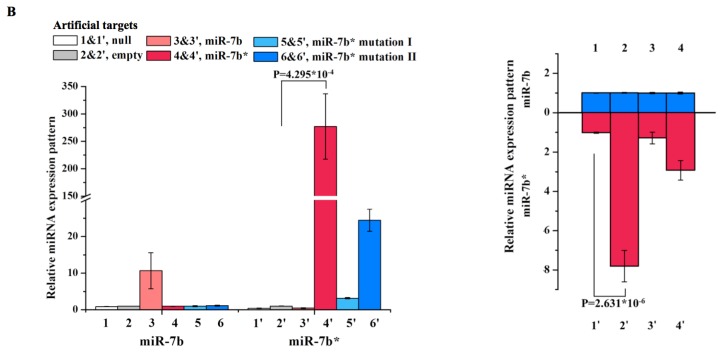
Figure 2.

Changed expression levels of miR-7b and miR-7b* after transfection with multi-transcript artificial targets. (A) 24 h after transfection of miRNA artificial targets (1 and 1′. null, 2 and 2′. empty vector, 3 and 3′. miR-7b*, 4 and 4′. miR-7b* mutation I, 5 and 5′. miR-7b* mutation II), AtT-20 total RNA was extracted and analyzed by northern blotting using probes specific for miR-7b and miR-7b*, respectively. Lane 3′ shows that miR-7b* expression was significantly increased following transfection of the miR-7b* artificial target. In contrast, miR-7b expression was similar in non-transfected and miR-7b* artificial targets transfected samples; (B) Twenty-four hours after various artificial targets (1 and 1′. null, 2 and 2′. empty vector, 3 and 3′. miR-7b, 4 and 4′. miR-7b*, 5 and 5′. miR-7b* mutation I, 6 and 6′. miR-7b* mutation II) were transfected, miR-7b (left) and miR-7b* (right) expression levels were analyzed by qRT-PCR. miRNA expression levels were normalize to U6. Fold changes are expressed versus empty target of each (2 or 2′); (C) Twenty-four hours after various artificial targets (1 and 1′. empty vector, 2 and 2′. miR-7b*, 3 and 3′. miR-7b* mutation I, 4 and 4′. miR-7b* mutation II) were transfected, AtT-20 lysates were immunoprecipitated (IP) using anti-Ago2 antibody. IPs were analyzed by immunoblotting with the same anti-Ago2 antibody (upper panel). Co-immunoprecipitated RNA was extracted and analyzed by qRT-PCR (lower panel). Fold changes are expressed versus the empty target for each (1 or 1′). Error bars in graphs indicate standard deviations; p-values are also indicated.

