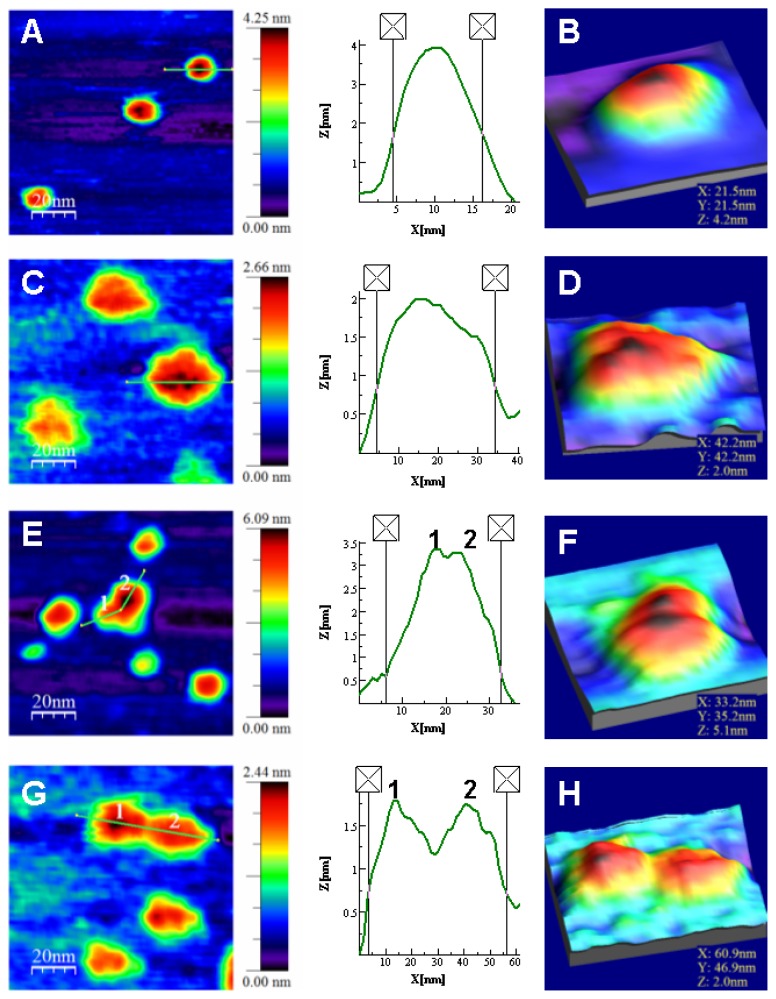
Figure 5.
Topography TM-AFM images and Z-height profiles associated to the lines on selected features (any individually identified element in the images) of NS3 samples. (A) NS3 monomers in presence of zinc and Z-height profile on a single monomer amplified in (B) using the zoom WSXM function [60]; (C) NS3 monomers in the absence of zinc and Z-height profile on a single monomer amplified in (D); (E) Monomers and dimer found in zinc containing samples; Z-height profile associated to the dimer and (F) image of the dimer showed in detail; (G) Monomers and dimer found in samples with no zinc; Z-height profile associated to the dimer and (H) image of the dimer shown in detail. Numbers 1 and 2 indicate the corresponding monomers composing the dimers. The 2D images show scanned areas of 100 × 100 nm, meanwhile the areas of the 3D images were chosen to show the isolated feature in detail.

