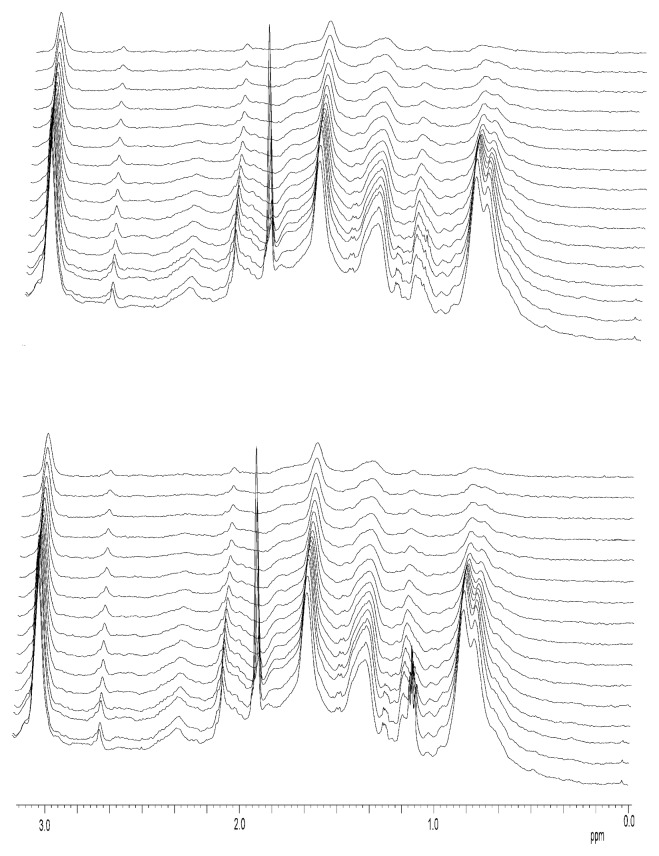
Figure A1.
Stacked plots for DOSY-NMR measurements to zinc-bound NS3 protease. The exponential decay curves of NS3 shown in Figure 4 of the main text were obtained from 1D-plots as those shown in this figure, by integration of the peaks between 1.0 and 0.5 ppm. The amide region did not show any peak, apart of the aromatic residues, due to the fact that DOSY experiments were carried out in D2O, after several hours of exchange in Amicon centrifugal devices. The two different stacked plots for the two different samples of the zinc-bound NS3 are shown (see main text for the diffusion coefficients obtained). For the zinc-free NS3 similar plots were obtained. Experiments were acquired at 25 °C, at pH 5.4 (uncorrected for isotope effects).

