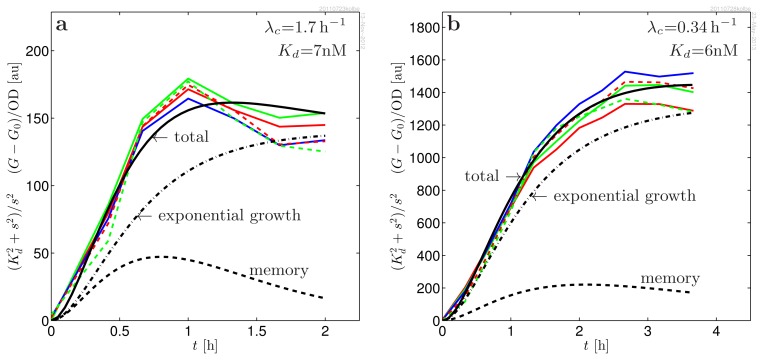
Figure 3.
Data collapse of the induced response of MH155 [Plac-lasR PlasB-gfp(ASV)] to predetermined concentrations of signal molecules, s = [OdDHL] = 100 nM (red), 50 nM (green), 25 nM (blue), 12 nM (dash red) and 6 nM (dash green), at two different growth rates. The data collapse is obtained by dividing out the signal molecule switch, , as indicated in the ordinate label. Practically, the same Kd is observed in the least square fitting at the two very different growth rates. The time structure is completely determined by the production and maturation of the unstable variant of green fluorescent protein, GFP(ASV), and is independent of the signal molecule concentration. This favors a picture where the regulator dimerization occurs before its binding to the signal molecules, the kinetics is fully cooperative, and the LasR dimer is fully protected already before ligand binding. The model curves are produced with the parameters in Table 1. In the model curves (black), the total yield (full) has been separated into the memory of past growth conditions (dash) and the component from exponential growth (dash-dotted), described in Equation (35).

