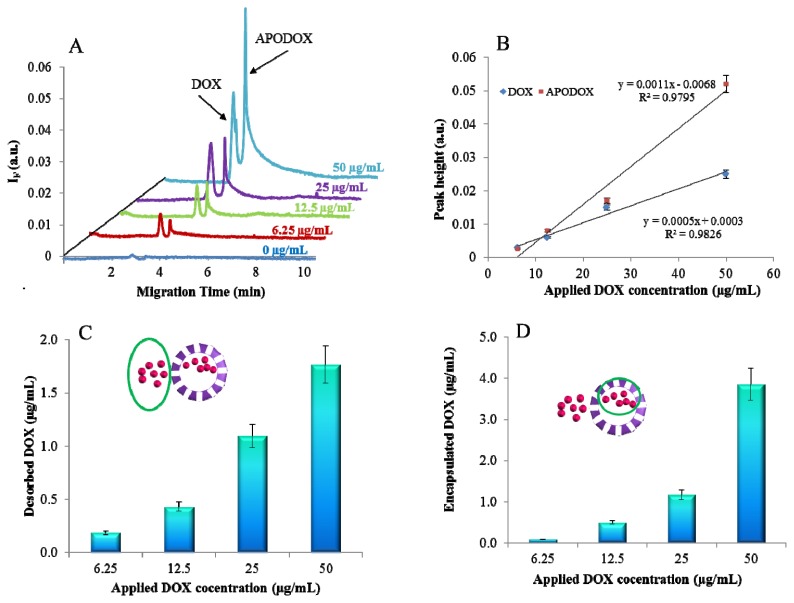
Figure 3.
CE characterization of APODOX. (A) Typical electropherograms of APODOX solutions prepared by different concentrations (0, 6.25, 12.5, 25 and 50 μg/mL) of applied DOX; (B) Dependence of peak heights of DOX and APODOX peaks on the concentrations of applied DOX (0, 6.25, 12.5, 25, 50 μg/mL); (C) Dependence of the concentration of free DOX in the solution on the applied DOX concentration (0, 6.25, 12.5, 25 and 50 μg/mL); (D) Dependence of encapsulated DOX concentration on the applied DOX concentration (0, 6.25, 12.5, 25 and 50 μg/mL).

