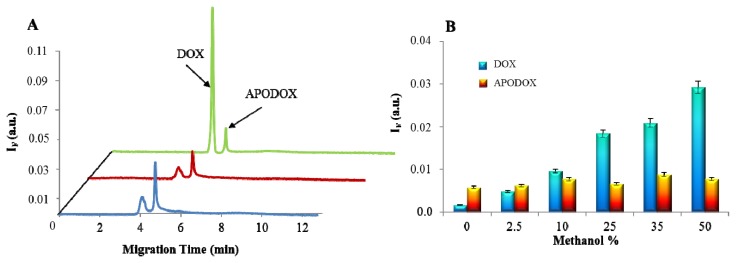
Figure 5.
Methanol influence on fluorescent analysis of APODOX. (A) CE-LIF of APODOX (25 μg/mL) nondiluted (blue trace), diluted 1:1 by H2O (red trace) and diluted 1:1 by MeOH (green trace), for conditions see Figure 2; (B) Dependence of peak heights on MeOH percentage in the injected sample.

