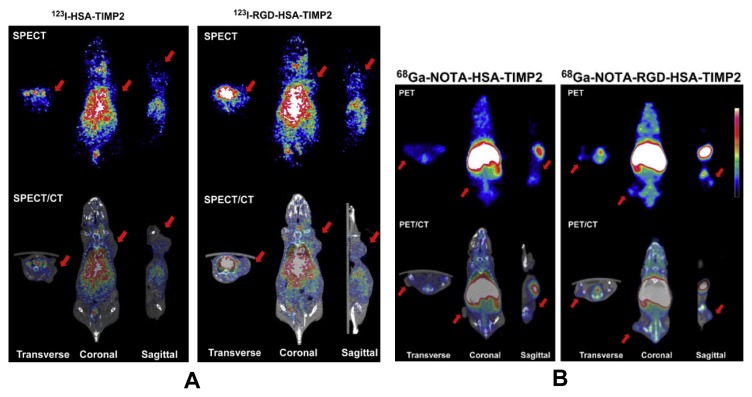
Figure 4.
The SPECT and SPECT/CT images of 123I-HSA-TIMP2 (A, left) and 123I-RGD-HSA-TIMP2 (A, right) and the PET and PET/CT images of 68Ga-NOTA-HSA-TIMP2 (B, left) and 68Ga-NOTA-RGD-HSA-TIMP2 (B, right). Red arrows indicated the U87MG tumor. Reprinted with permission from [21].

