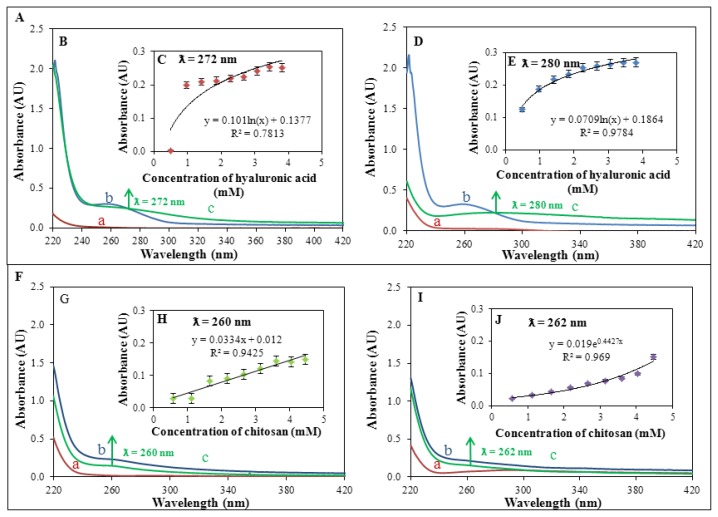
Figure 5.
(A) Dependence of creation of a complex on applied concentration of hyaluronic acid (HA); (B) Spectral analysis in the range of 220–420 nm, a = 100 μM AgNO3, b = 24.9 mM HA and c = complex of 24.9 mM HA and 100 μM AgNO3, λ = 272 nm; (C) Dependence of creation of a complex (HA + 100 μM AgNO3) on applied concentration of HA, λ = 272 nm; (D) Spectral analysis within the range of 220–420 nm, a = 100 μM SPNPs, b = 24.9 mM HA and c = complex of 24.9 mM HA and 100 μM SPNPs, λ = 280 nm; (E) Dependence of creation of a complex (HA + 100 μM SPNPs) on applied concentration of HA, λ = 280 nm; (F) Dependence of creation of a complex on applied concentration of chitosan (CH); (G) Spectral analysis in the range of 220–420 nm, a = 100 μM AgNO3, b = 29.3 mM CH and c = complex of 29.3 mM CH and 100 μM AgNO3, λ = 260 nm; (H) Dependence of creation of a complex (CH + 100 μM AgNO3) on applied concentration of CH, λ = 260 nm; (I) Spectral analysis in the range of 220–420 nm, a = 100 μM SPNPs, b = 29.3 mM CH and c = complex of 29.3 mM CH and 100 μM SPNPs, λ = 262 nm; (J) Dependence of creation of a complex (CH + 100 μM SPNPs) on applied concentration of CH, λ = 262 nm.

