Figure 3.
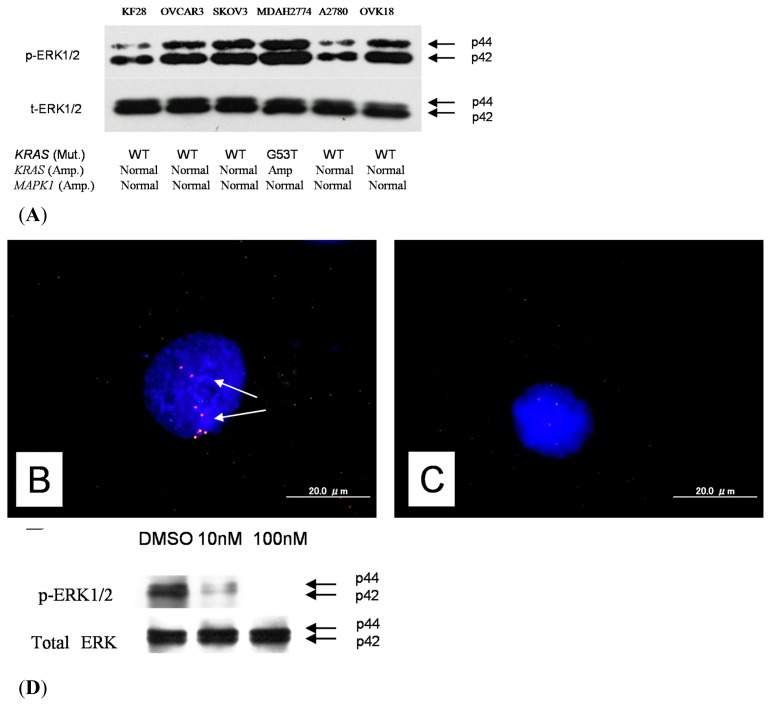
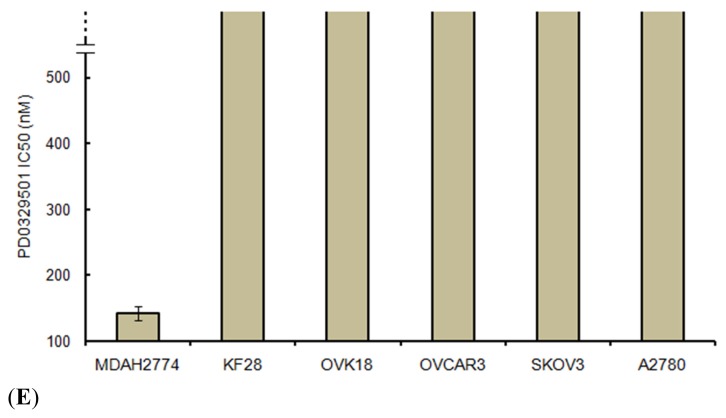
Western blot analysis. (A) Western blot analysis showed a higher level of p-ERK protein expression in MDAH2774 cells than in other cell lines; (B) Dual-color fluorescence in situ hybridization (FISH) validated amplification of the KRAS gene in ovarian cancer cell line (MDAH2774) White arrows indicate amplification of KRAS gene; (C) OVCAR3 cells contained signals for both KRAS and reference probes with an approximate 1:1 ratio; (D) Western blot analysis showed a significant reduction in p-ERK protein in PD0328901-treated cells compared with control DMSO-treated cells; (E) IC50 values for the selective MEK1/2 inhibitor PD0325901 for 6 type II ovarian carcinoma cell lines. MDAH2774 cells with KRAS amplification were more sensitive to growth inhibition by the selective MEK1/2 inhibitor PD0325901 than cells without KRAS amplification. The mean and SD were obtained from 3 experiments.


