
Figure 4.
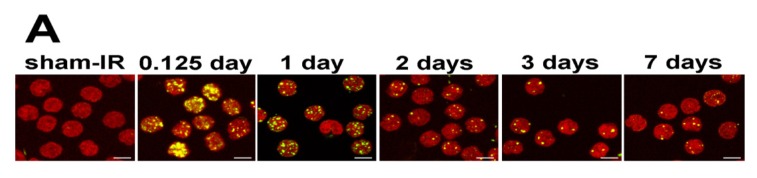

Distribution of γ-H2AX foci in peripheral blood lymphocyte populations taken at various times after exposure of minipigs to ionizing radiation. (A) Representative images of lymphocyte samples taken from minipigs 0.125, 1, 3, 7 and 10 days after 5 Gy TBI. Sham-irradiated animals were processed identically to the others. Green, γ-H2AX; red, DNA stained with PI; (B) The graphs show the percentage of lymphocyte populations with the noted number of γ-H2AX foci at the noted times and doses. Minipigs were exposed to 1.8, 3.8 and 5.0 Gy total body irradiation from a Co-60 source and allowed to recover. The graphs compare the samples taken from irradiated animals with unirradiated animals. The individual irradiated animals are noted by different color distribution curves (in each column). The focus distributions in the samples with the lowest and the highest foci per cell values are shown in red and blue respectively. Scale bars, 5 μm.