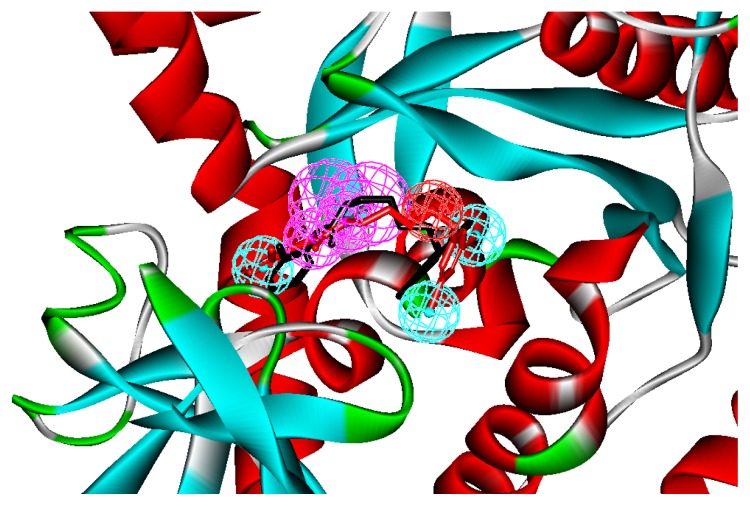
Figure 2.
The mapping of the structure-based pharmacophore and the best mapping conformation (red bars) and the bound conformation (black bars) for the ligand to methione tRNA synthetase (MetRS) are superimposed on the pharmacophore model. Screenshots were taken from Discovery Studio. Features of the pharmacophore models are color-coded as follows: Hydrogen bond acceptor (HBA), green; hydrogen bond donor (HBD), violet; hydrophobic (H), light blue; positive ionizable (pos), red.

