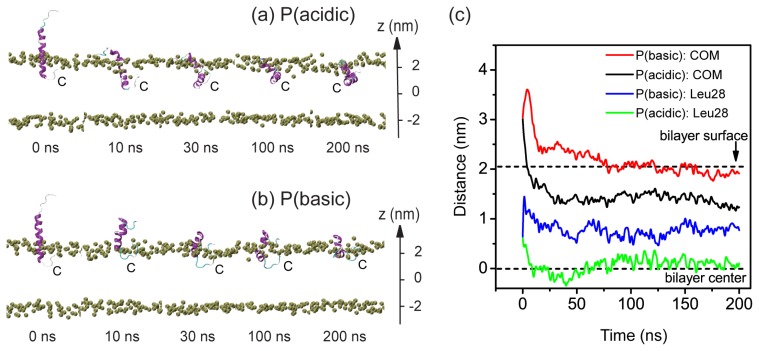
Figure 2.
Detailed analysis of the two MD trajectories for system P at acidic and basic pHs. Snapshots at five different time points in the MD runs of (a) P (acidic) and (b) P(basic). The peptide is shown in ribbon. The phosphorous atoms of the lipids are shown in tan spheres to display the bilayer surface. The other atoms of POPC lipid molecules and water molecules are not shown for clarity. The bilayer center is set at z = 0; (c) The z-position of the center-of-mass (COM) of pHLIP backbone atoms and the z-position of the most deeply inserted atom in residue Leu28 as a function of time. The two dashed black lines at z = 2.05 nm and z = 0 nm corresponds to the bilayer surface (the headgroup phosphorus atoms) of the upper leaflet and the bilayer center, respectively.

