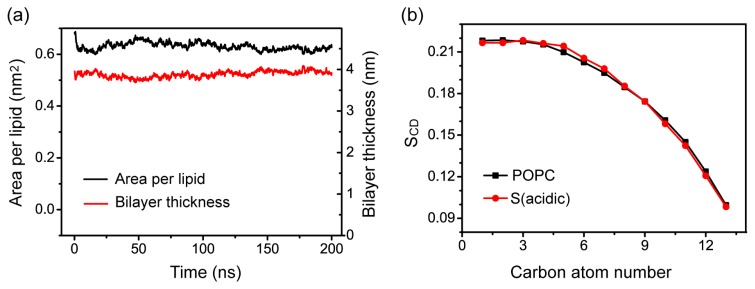
Figure 8.
Characterization of the ordering of POPC bilayer. (a) Time evolution of area per lipid and bilayer thickness in simulation S (acidic); (b) Time-averaged order parameter SCD of sn-1 chain of POPC lipids over the last 50-ns of MD run of S (acidic). For comparison, the SCD of sn-1 chain obtained from a 20 ns MD run for pure POPC lipid bilayer is also presented.

