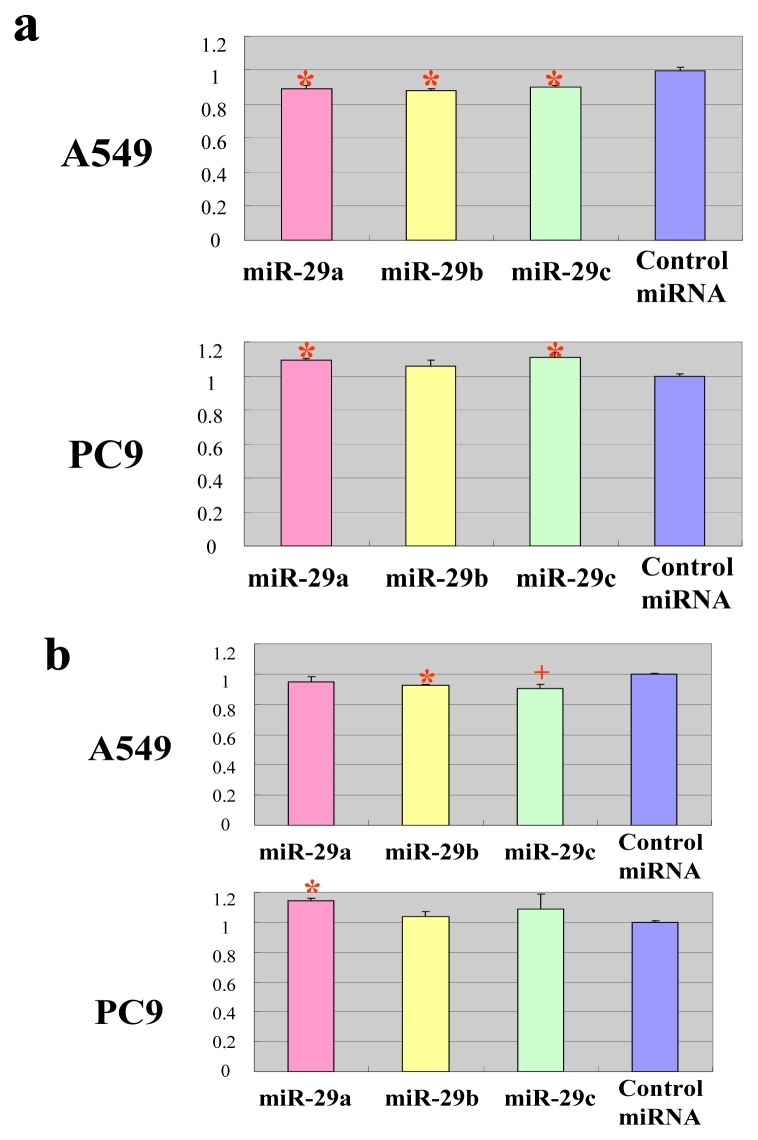
Figure 5.
The DNA methylation level of cells transfected with miR-29 or control miRNA. (a) The global DNA methylation level. A luminometric methylation assay (LUMA) assay was performed 48 h after transfection of A549 or PC9 cells with miR-29a, miR-29b, miR-29c or control miRNA. Data are normalized to the DNA methylation ratio of cells transfected with control miRNA. Data show the mean + SD for n = 3 repeats. *p < 0.01, compared with control miRNA; (b) The DNA methylation level of RASSF1. A quantitative methylation-specific PCR of RASSF1 was performed. *p < 0.01, +p < 0.05, compared with control miRNA.

