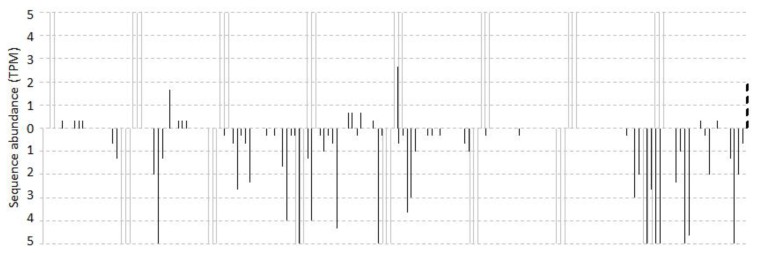
Figure 1.
Abundance distribution of sRNAs mapped to vviTAS3. The number of reads with a 5′ end at each position is plotted. Bars above the sequence represent sense reads; those below represent antisense reads. The cleavage site of vvi-miR390 is marked by a vertical dotted line. Vertical gray lines indicate the miRNA-set 21-nt phased cleavage, allowing a 1-nt offset. Regions with TPMs greater than five are not shown.

