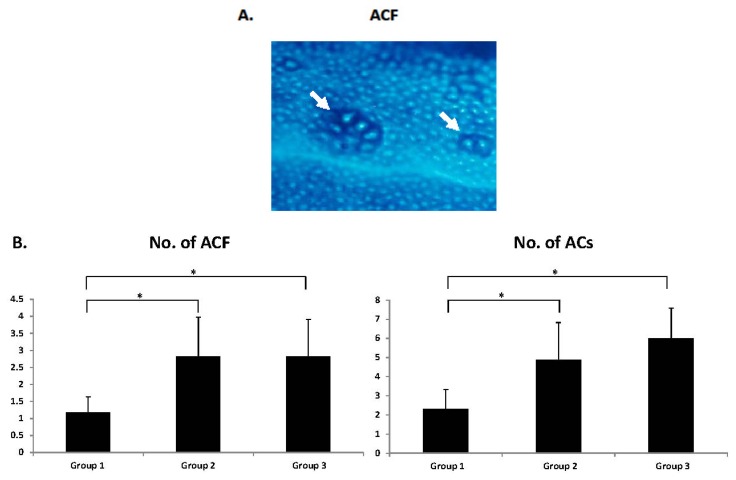
Figure 1.
ACF developed in the SHRSP, SHRSP-ZF, and WKY rats that received AOM. (A) Representative morphology of ACF (arrows) induced by AOM stained with methylene blue in Group 2. Magnification, 40×; (B) Average number of ACF and ACs (/cm2). Group 1: WKY rats, Group 2: SHRSP rats, and Group 3: SHRSP-ZF rats. The values are expressed as mean ± SD. * p < 0.05.

