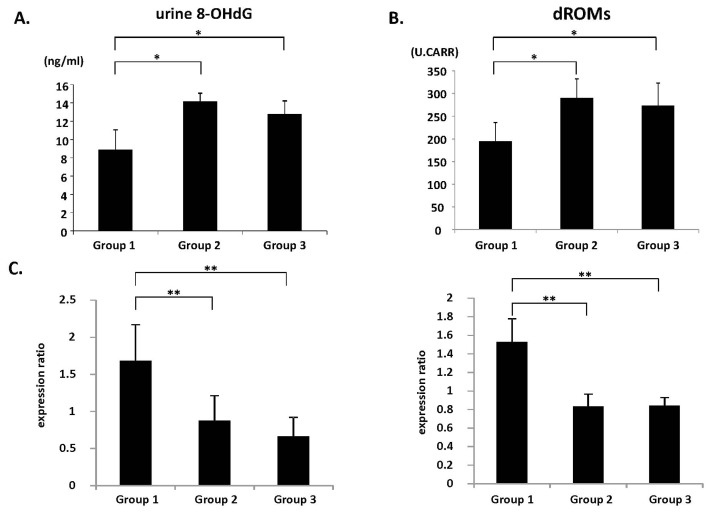
Figure 2.
Measures of oxidative stress and antioxidant biomarkers’ expression. (A) Urine 8-OHdG levels were measured by enzyme immunoassay; (B) Hydroperoxide levels in the serum were determined by the d-ROM test; (C) The expression levels of GPx and CAT mRNA in the colonic epithelium were examined by quantitative real-time RT-PCR using specific primers. The values are expressed as mean ± SD. * p < 0.01, ** p < 0.01.

