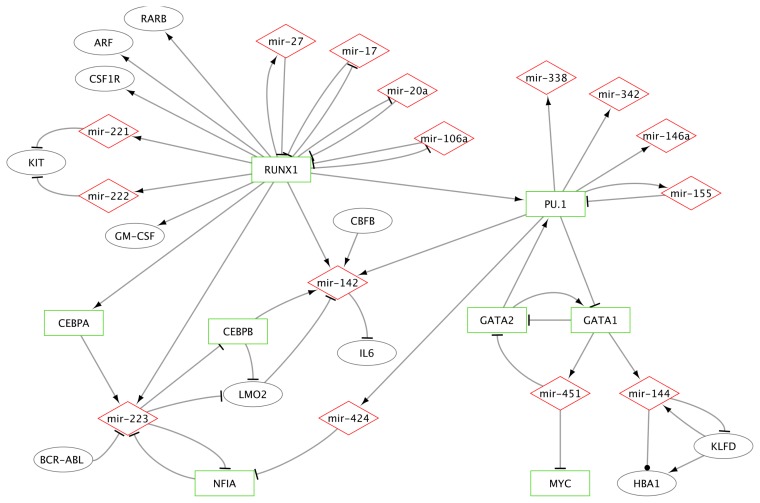
Figure 3.
Partial representation of the network involving microRNAs (mir) and regulatory proteins in hematopoiesis. Network was built using Cytoscape 2.8.2 software [36]. Transcription factors are represented as green rectangles, miRNAs as red diamonds, and other proteins as grey ellipses. Arrows depict relationships: arrows (activation), T (inhibition), circle (undetermined/binding). RARB, Retinoic acid receptor B, ARF, Alternate Reading Frame, CSF1R, colony-stimulating factor 1 receptor; BCR-ABL, breakpoint cluster region-Abelson; CBFB, Core-binding factor subunit beta; IL6, interleukine 6; LMO2, LIM domain only 2; HBA1, hemoglobin A1; KLFD, Krüppel like factor D; RUNX1, Runt-related transcription factor 1; CEBPA, CCAAT/enhancer-binding protein alpha; CEBPB, CCAAT/enhancer-binding protein beta; GM-CSF, granulocyte macrophage-colony stimulating factor; NFIA, nuclear factor I-A.

