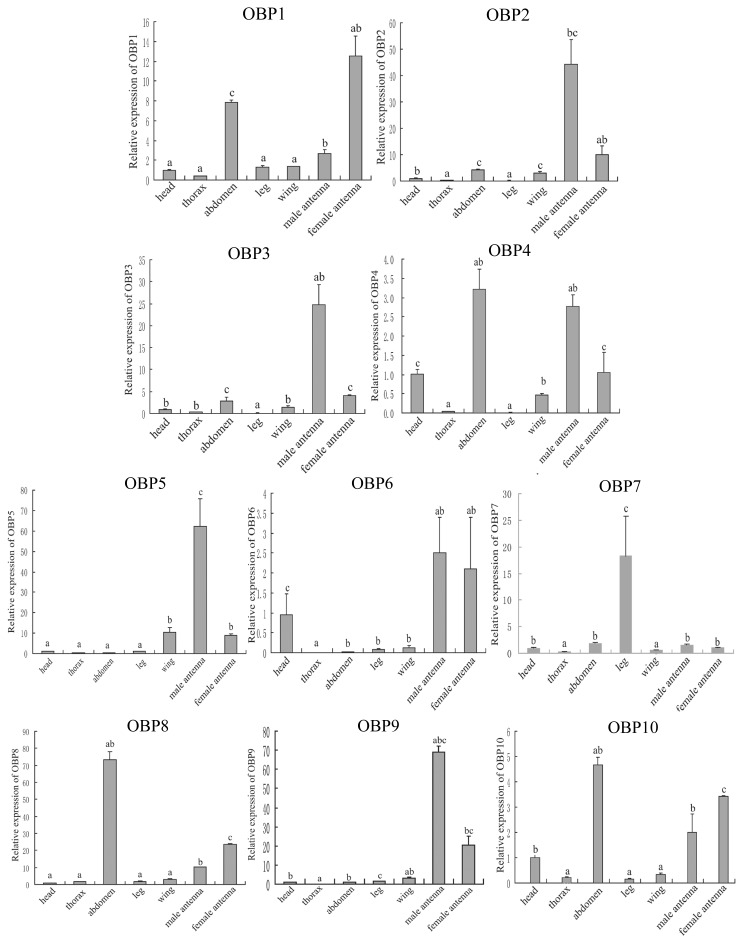
Figure 4.
Tissue distribution of the ten identified OBPs. qRT-PCR to analyze OBP transcript levels in different tissues of mature adults during the oviposition period, including head, thorax, abdomen, leg, wing, male antennae, and female antennae. Relative transcript levels are calculated using β-actin as the standard. Different letters indicate significant differences in the expression level of OBPs (p < 0.05, Duncan’s test). Three biological replicates were performed.

