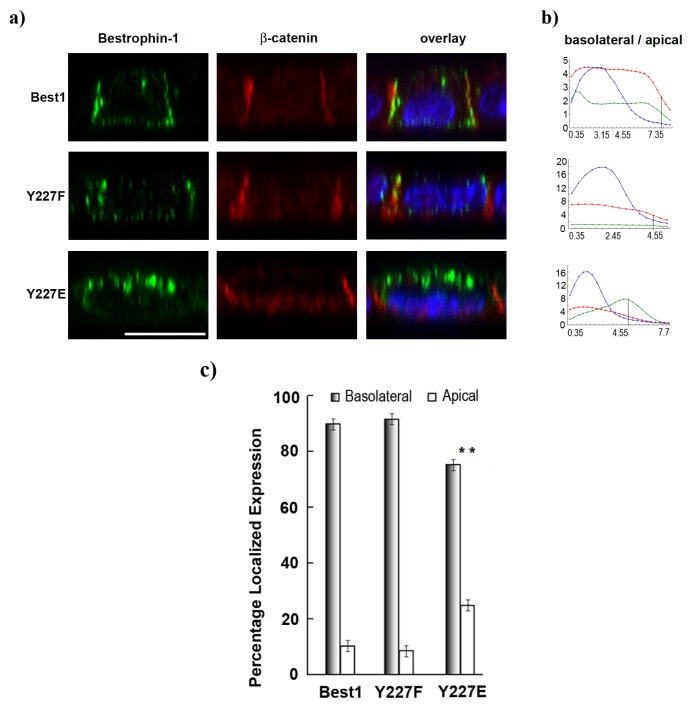
Figure 6.
(a) X-Z confocal single scan showing that constitutively phosphorylated Best1 (Y227E) is partially targeted to the apical membrane compared to normal and non-phosphorylated (Y227F) Best1. Best1 in green, β-catenin in red, nuclei in blue. Scale bar = 10 μm; (b) Quantification of basolateral to apical localization of the three markers (Best1, green; β-catenin, red; nuclei, blue) along the Z-axis confirming the result. Vertical line indicated basolateral-apical domains separation. Horizontal axis represents μm distance and vertical axis shows pixel intensities; (c) Bar graph of the repartition percentage of Best1 between basolateral and apical domains (mean ± SEM., n = 10, **p < 0.005).

