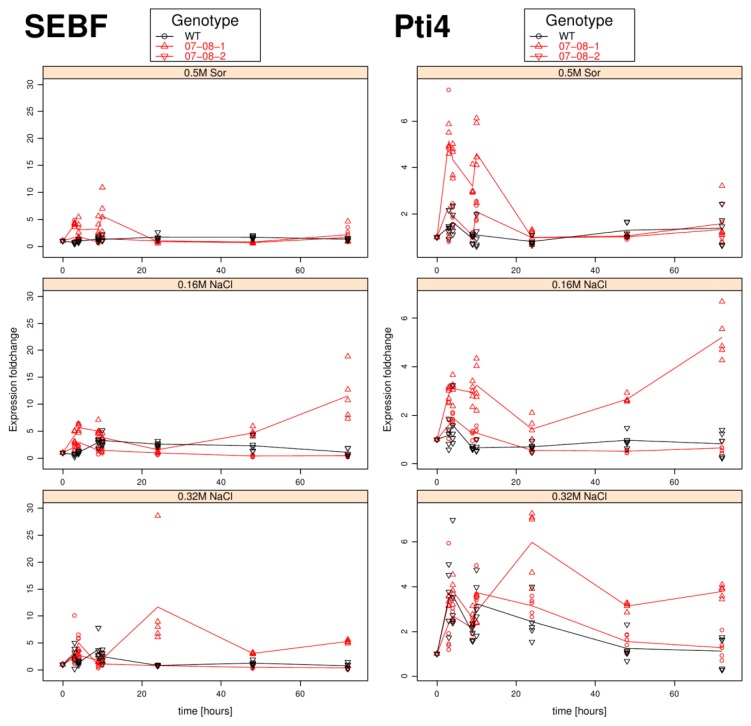
Figure 2.
Time course of sebf (left column) and pti4 (right column) gene-expression fold changes of cells osmotically stressed, as indicated. Measurements for all five independent samples per time point and treatment group are displayed as symbols (circles and triangles) indicating individual measurements and lines are giving their averages. WT, wild type.

