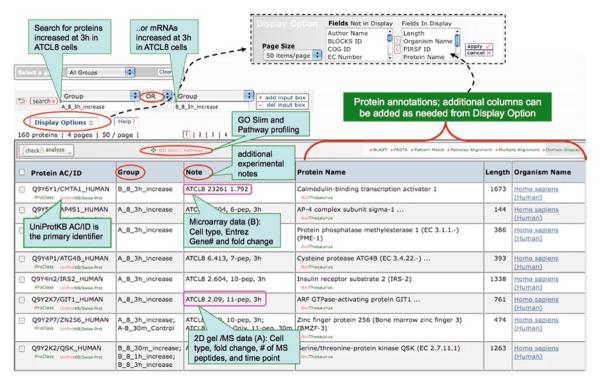
Fig. 2.

iProXpress interface for browsing, searching, and functional profiling of Omics data. As an example, the interface displays the proteomic data sets derived from 2D gel and mass spectrometry as well as the gene expression microarray data sets from ATM− (AT5BIVA) and ATM+ (ATCL8) human fibroblast cells (54).
