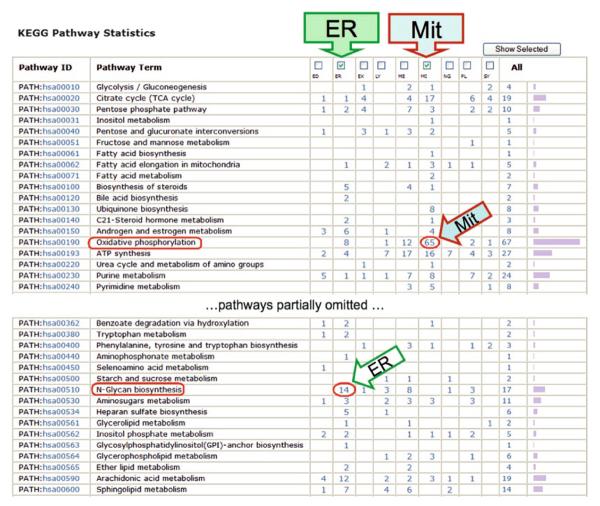
Fig. 4.
Comparative profiling of organellar proteomes using KEGG pathways. Proteomes of nine organelles (56) are profiled using KEGG pathways. Although only a small portion of the proteome is covered by the KEGG pathways, the profiles show striking contrast between organelles, e.g., endoplasmic reticulum (ER) and mitochondria (Mit) enriched for “oxidative phosphorylation” and “N-Glycan biosynthesis” pathways (encircled on the left), respectively.

