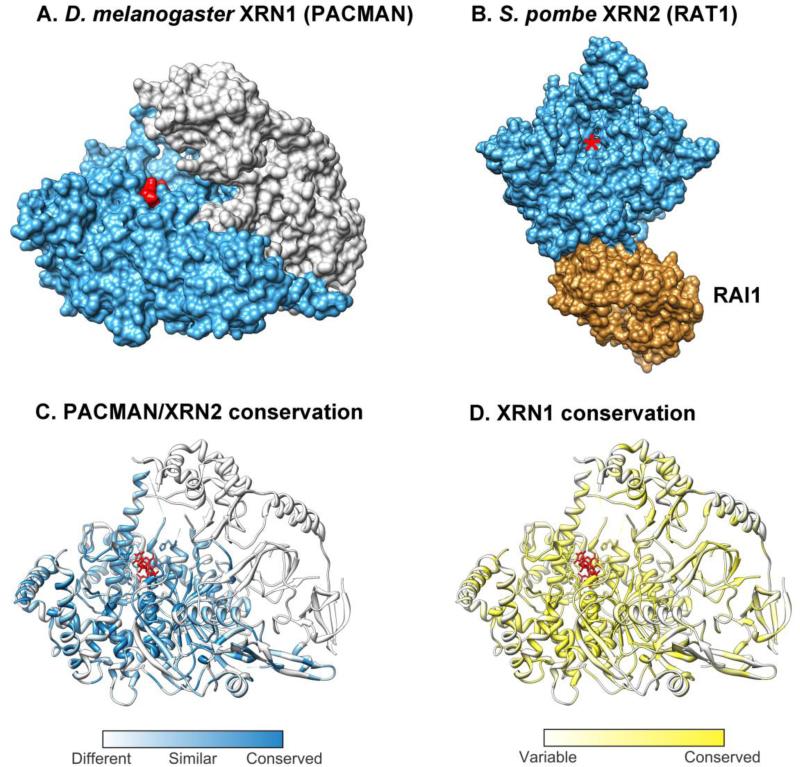
Fig 2. Structural comparisons between XRN1 and XRN2.
A) Crystal structures of D. melanogaster XRN1 (PACMAN, PDB ID: 2Y35, residues 1-1141 of 1612) [69]. The catalytic domain (N-terminal) of PACMAN is shown in blue with three nucleotides of decapped RNA (red) bound in the active site. The C-terminal is shown in grey. B) S. pombe XRN2 (RAT1, PDB ID: 3FQD, residues 1-885 of 991) with its binding partner RAI1 (all of 352 residues) [66]. XRN2 is shown in blue with the active site marked by a red asterisk. RAI1 is shown in light brown. C) Similarity of residues between XRN1 and XRN2. Residues of PACMAN are colored by similarity to residues in D. melanogaster XRN2. Residues are most strictly conserved around the active site and less so towards the C-terminal, much of which is not present in XRN2. D) Conservation of residues across 195 eukaryotic XRN1s. Conservation is greatest around the active site, but there is also good conservation in parts of the C-terminal. Multiple alignment and conservation scores were calculated using ConSurf [68], which takes into account the phylogenetic distance between species. XRN2 alignments were excluded from the calculation. All images (and the alignment of PACMAN and XRN2 sequences) were produced in UCSF Chimera [186].

