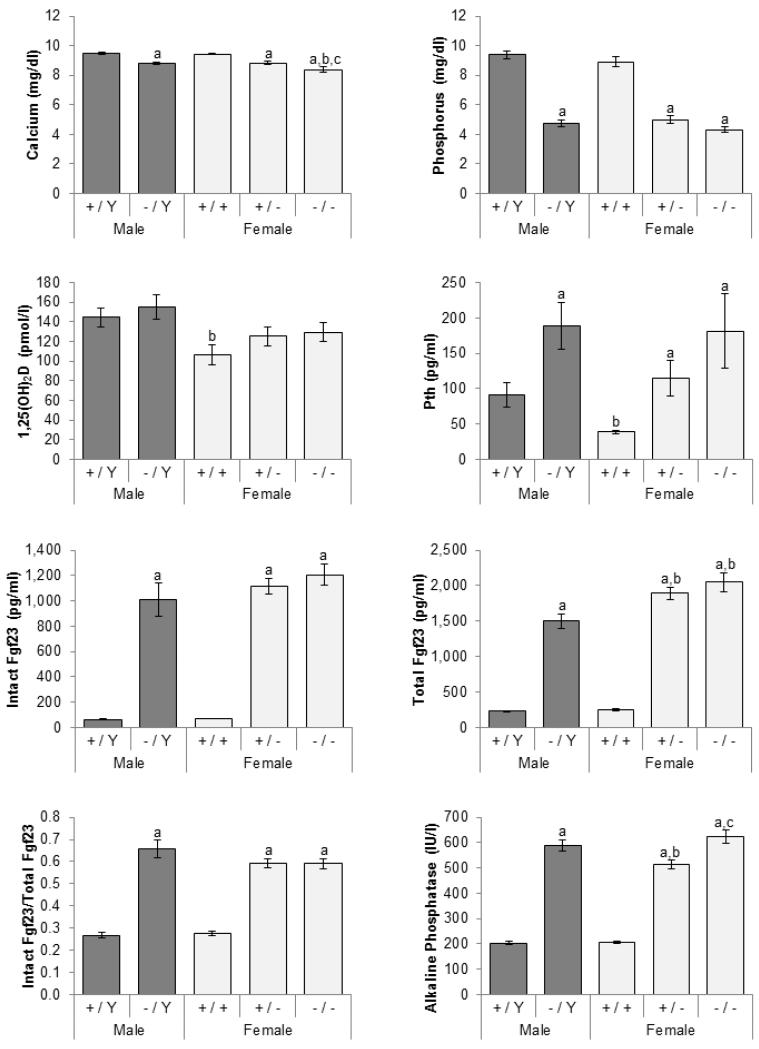
Figure 1.
Effects of Phex genotypes on serum biochemistries. Total Fgf23 represents intact Fgf23 protein and C-terminal fragments of Fgf23 measured by C-terminal ELISA. Dark gray bars, males; light gray, females. Number of animals = 11-13 per group. The differences between five genotypic groups were significant for all measured parameters (ANOVA p-values < 0.05). Differences between individual groups are indicated by superscript letters: Significant difference to same-sex littermate controls (+/Y vs. −/Y and +/+ vs. +/− or +/+)a, comparable male genotypes (+/Y vs. +/+ and −/Y vs. +/− or −/−)b, and heterozygous females (+/− vs. −/−)c by unpaired t-test (p-value < 0.05). All values are presented as mean ± SEM.

