
Fig. 5.
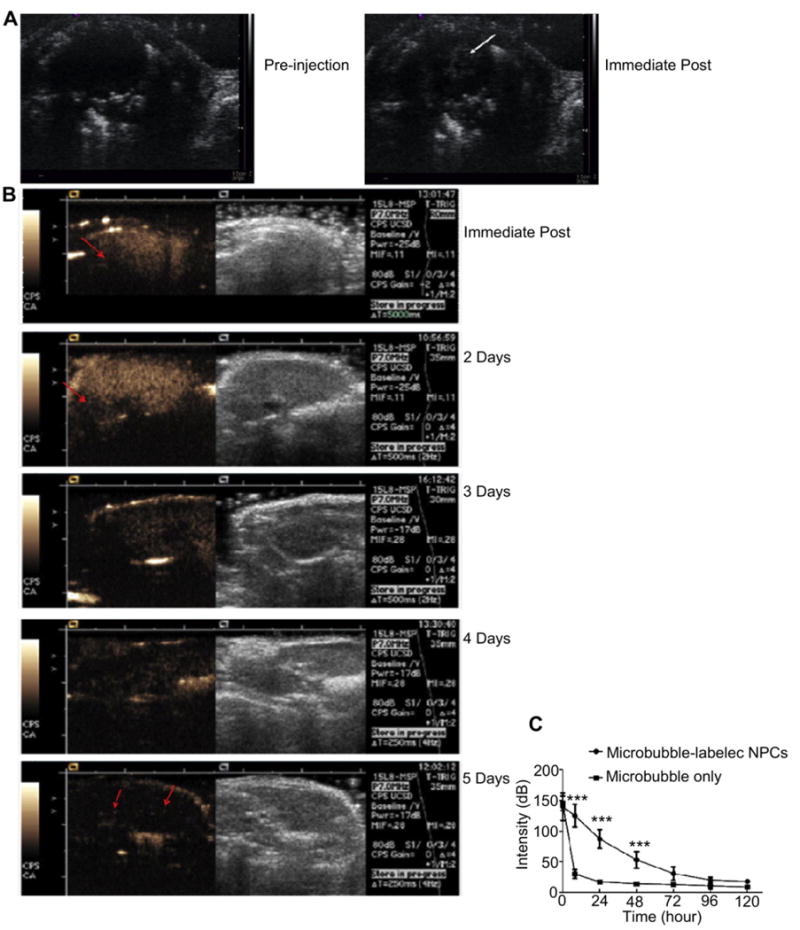
In vivo detection of MB-loaded NPCs. (A) Mouse heart imaged before and immediately after the intravenous injection of MB-labeled NPCs at 5 MHz center frequency. MBs can be seen in the left ventricle; (B) Dual display of B-mode (right) and CPS images (left) of a mouse liver imaged immediately after the IV administration of MB-labeled NPCs, and then again at 2, 3, 4, and 5 days later. Immediately post infusion, the MB-labeled NPC count was so high that the far field of the liver was shadowed (arrow). The shadowing diminished but was still observed at 2 days. The echoes became sparse by 3 days but were still visible by Day 5 (arrows); (C) Mean videointensity signal of the liver ± SEM of mice given MB-loaded NPCs or free MBs are plotted as a function of time. Note the rapid loss of liver signal following the injection of free MBs as compared to the persistent signal following MB-loaded NPCs.