Figure 7.
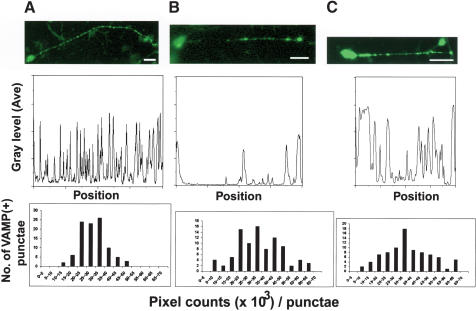
Disorganized vesicular membrane structures caused by Unc51.1.KR or SynGAP expression in cultured granule neurons. (Top) Although control cells expressing VAMP2–GFP fusion protein alone displayed regularly aligned VAMP-positive vesicles along axons (A), cells overexpressing SynGAP plus VAMP2–GFP (B) or Unc51.1.KR + VAMP2–GFP (C) had irregularly positioned vesicles. Bar, 10 μm. (Middle) Line-scan was done on the neurons shown above, and average gray levels were plotted along the entire length of the axons by using Metamorph analysis software (Universal Imaging Corporation). A peak within graphs corresponds to each VAMP2–GFP-positive punctae. (Bottom) Pixel counts per each punctae were done over ∼100 punctae for each infection experiment (VAMP2–GFP, left; SynGAP + VAMP2–GFP, center; Unc51.1.KR + VAMP2–GFP, right) by using Metamorph software, and each punctae was classified according to its pixel size. The X-axis shows the range of pixel sizes, and the Y-axis is the number of punctae that falls into each pixel size category shown in the X-axis.

