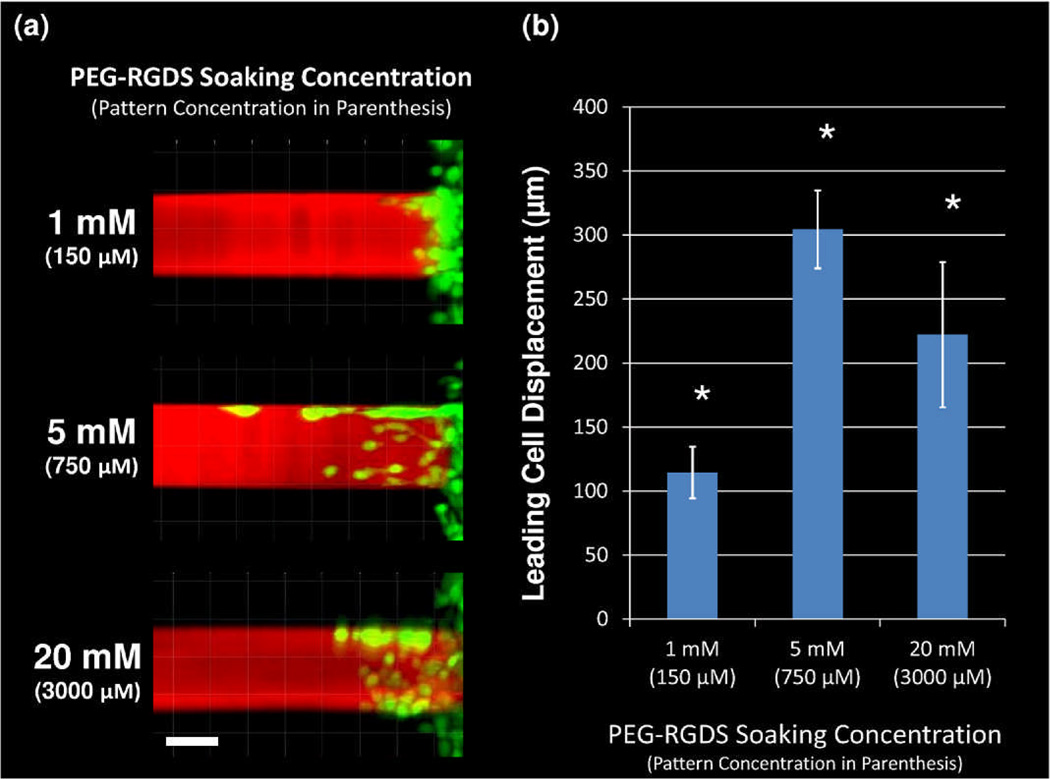
Fig. 6.
(a) After 1 day, HT1080s (green) have migrated into 3D micropatterns of varying concentrations of PEG-RGDS (red) within PEG-PQ hydrogels. The soaking concentration of PEG-RGDS is indicated with the functional PEG-RGDS concentration of each pattern below in parenthesis. All images are representative. Scale bar = 50 µm. (b) The total displacement of the leading cell along each 3D micropattern has a significant (*p<0.05) biphasic dependence on PEG-RGDS concentration.

