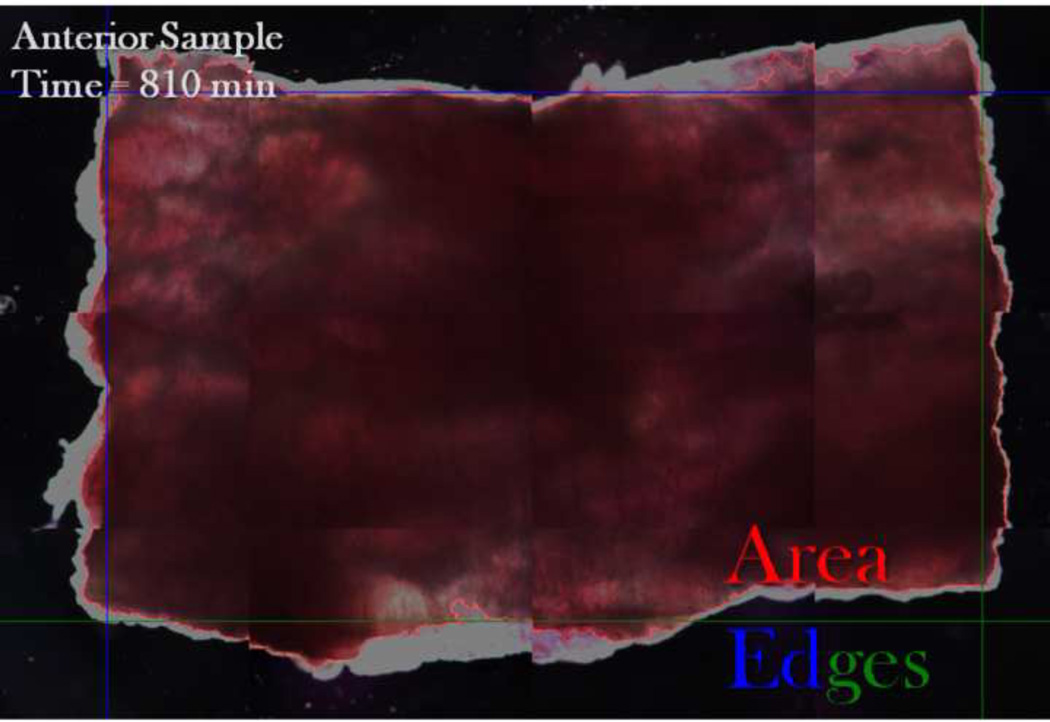
FIGURE 1.
Periosteal shrinkage measurements. A representative image of the periosteum shows reference points used for automated determination of change in area (red outline), axial length (difference between top and bottom edges), and circumferential length (difference between left and right edges). The left and top edges are shown in blue and the right and bottom edges of the sample are shown in green.

